Niagara Donut Chart
- New!
- Totals Different Values
- Easy-To-Configure
- Drag n' Drop
- Real-Time Updates
- Works in Workbench and Modern Browser
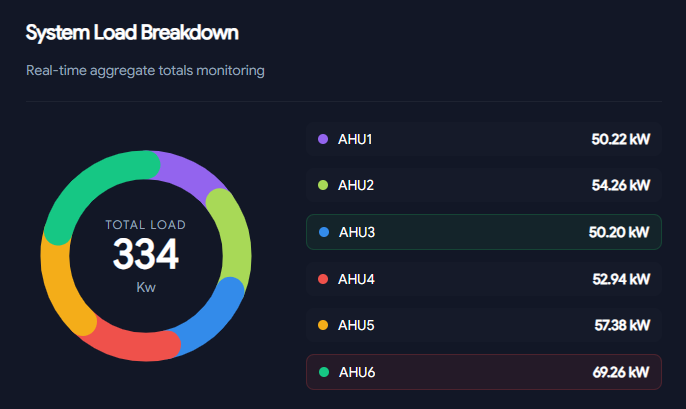
This component is a Dynamic SVG Donut Chart Widget designed for real-time automation dashboards to visualize operational load distribution across multiple assets. It automatically sums system values to scale vector segments proportionally, while continuously evaluating the dataset to highlight operational extremes - framing the highest consumer in alert red and the most efficient asset in eco-green. Equipped with fully synchronized hover interactions, interacting with either a chart slice or its legend card isolates that asset with a targeted glow filter, fades background elements, and temporarily pulls its precise value into the central readout before seamlessly restoring master system totals on cursor exit. A Google font is also included in the widget.
Are you looking for a cost effective way to manage and visualize data for all your customers? Why not have a look at View Builder?
Before you start. Download the modules from our portal (see your order confirmation, which also explains licensing). Copy the modules file to your modules directory. Restart BOTH station and Workbench.
1. Copy the donutChart-ux.jar file to your modules directory.
2. Open the module from your palette file.
3. Drag and drop the widget from the palette onto your px view.
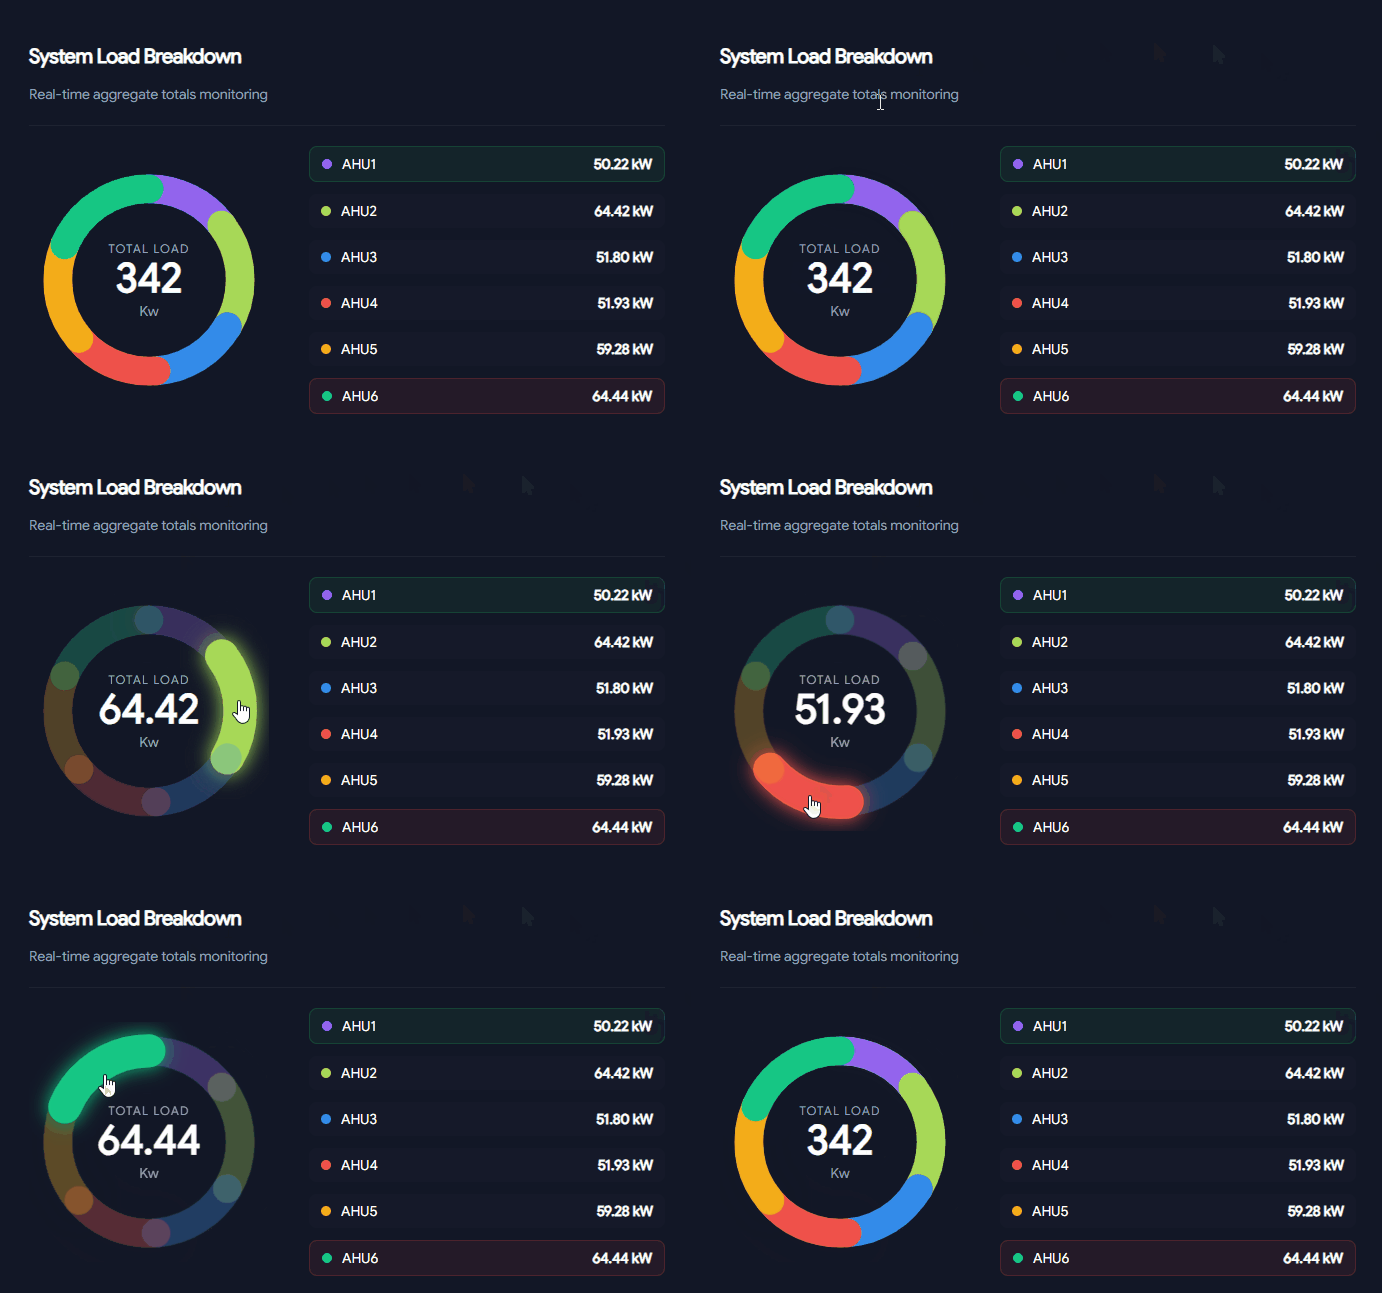
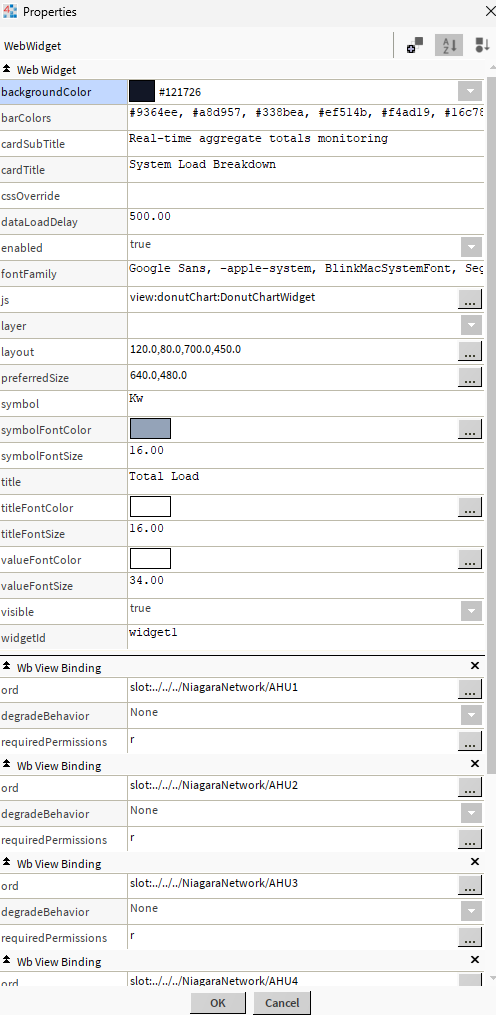
The widget has a number of configurable properties.
Ords:
Bind as many ords as needed. Default is 6, but more WB Bindings can be added on the widget property sheet. Add more bar colors as neeeded.
Css Override:
You can increment the widget id (e.g. widget2) if you have multiple widgets on screen to target their individual styling
Hide Legend:
#widget1 #legendContainer { display: none; }

Build Your Own dashboards and win Projects by showing data that increase value and reduces expenditure.