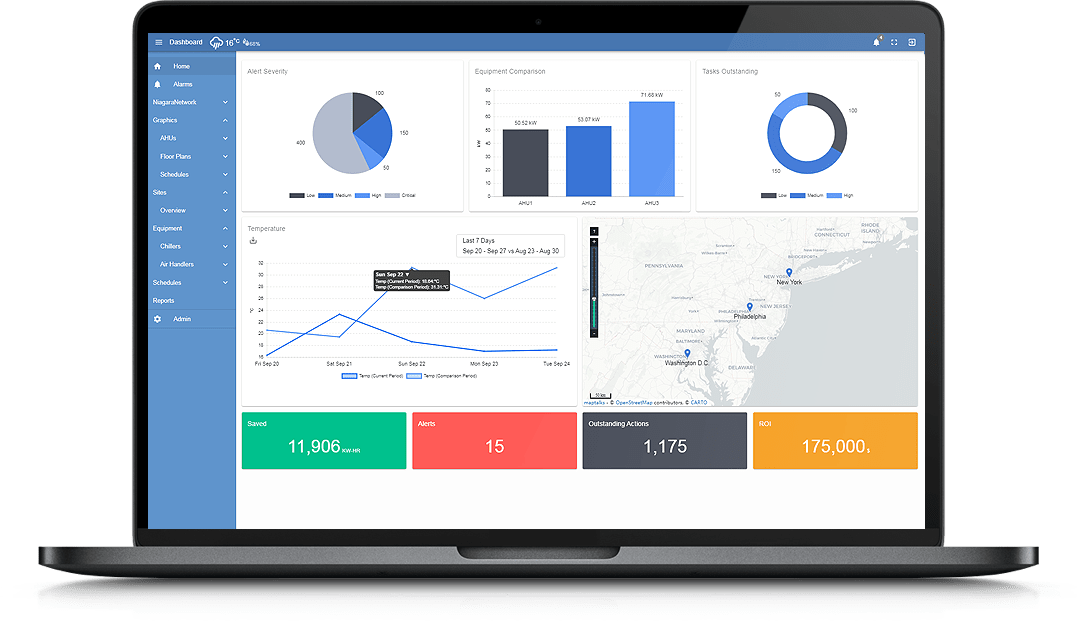
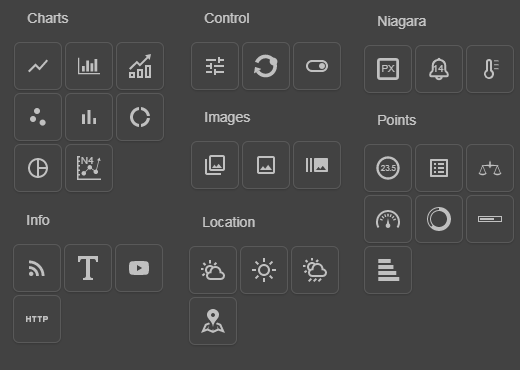
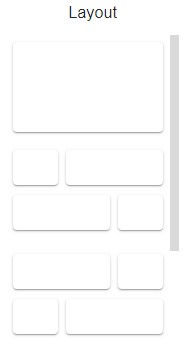
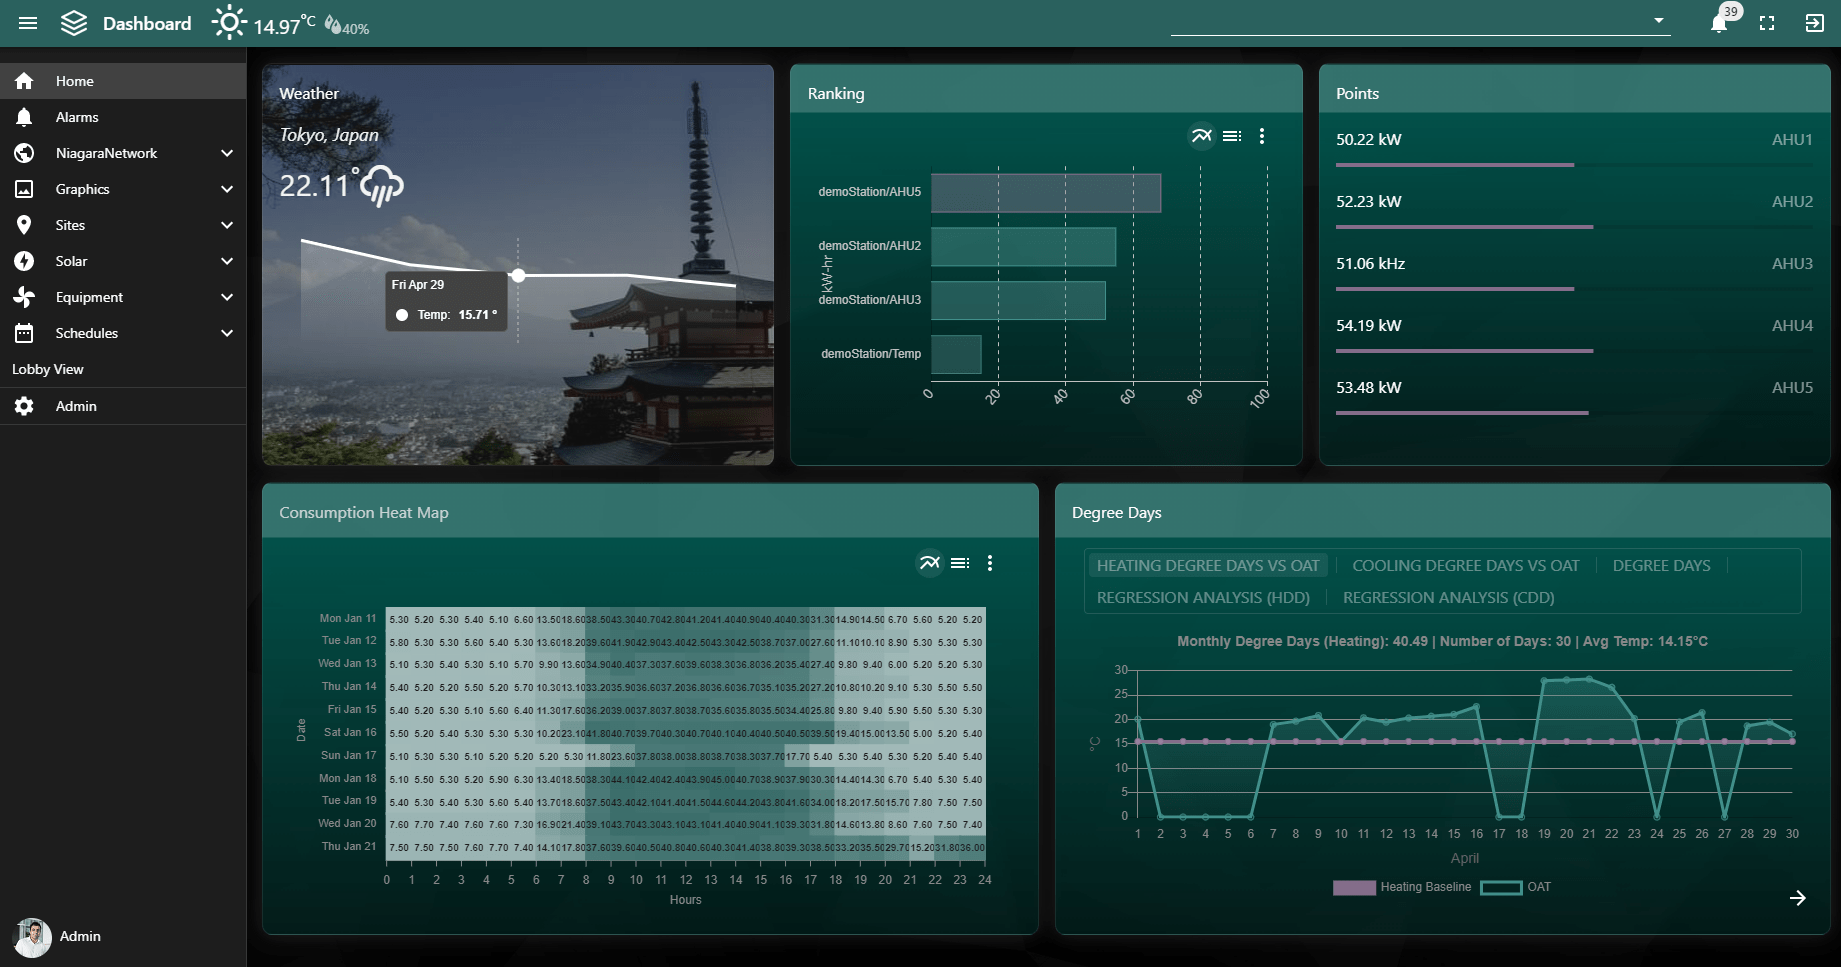
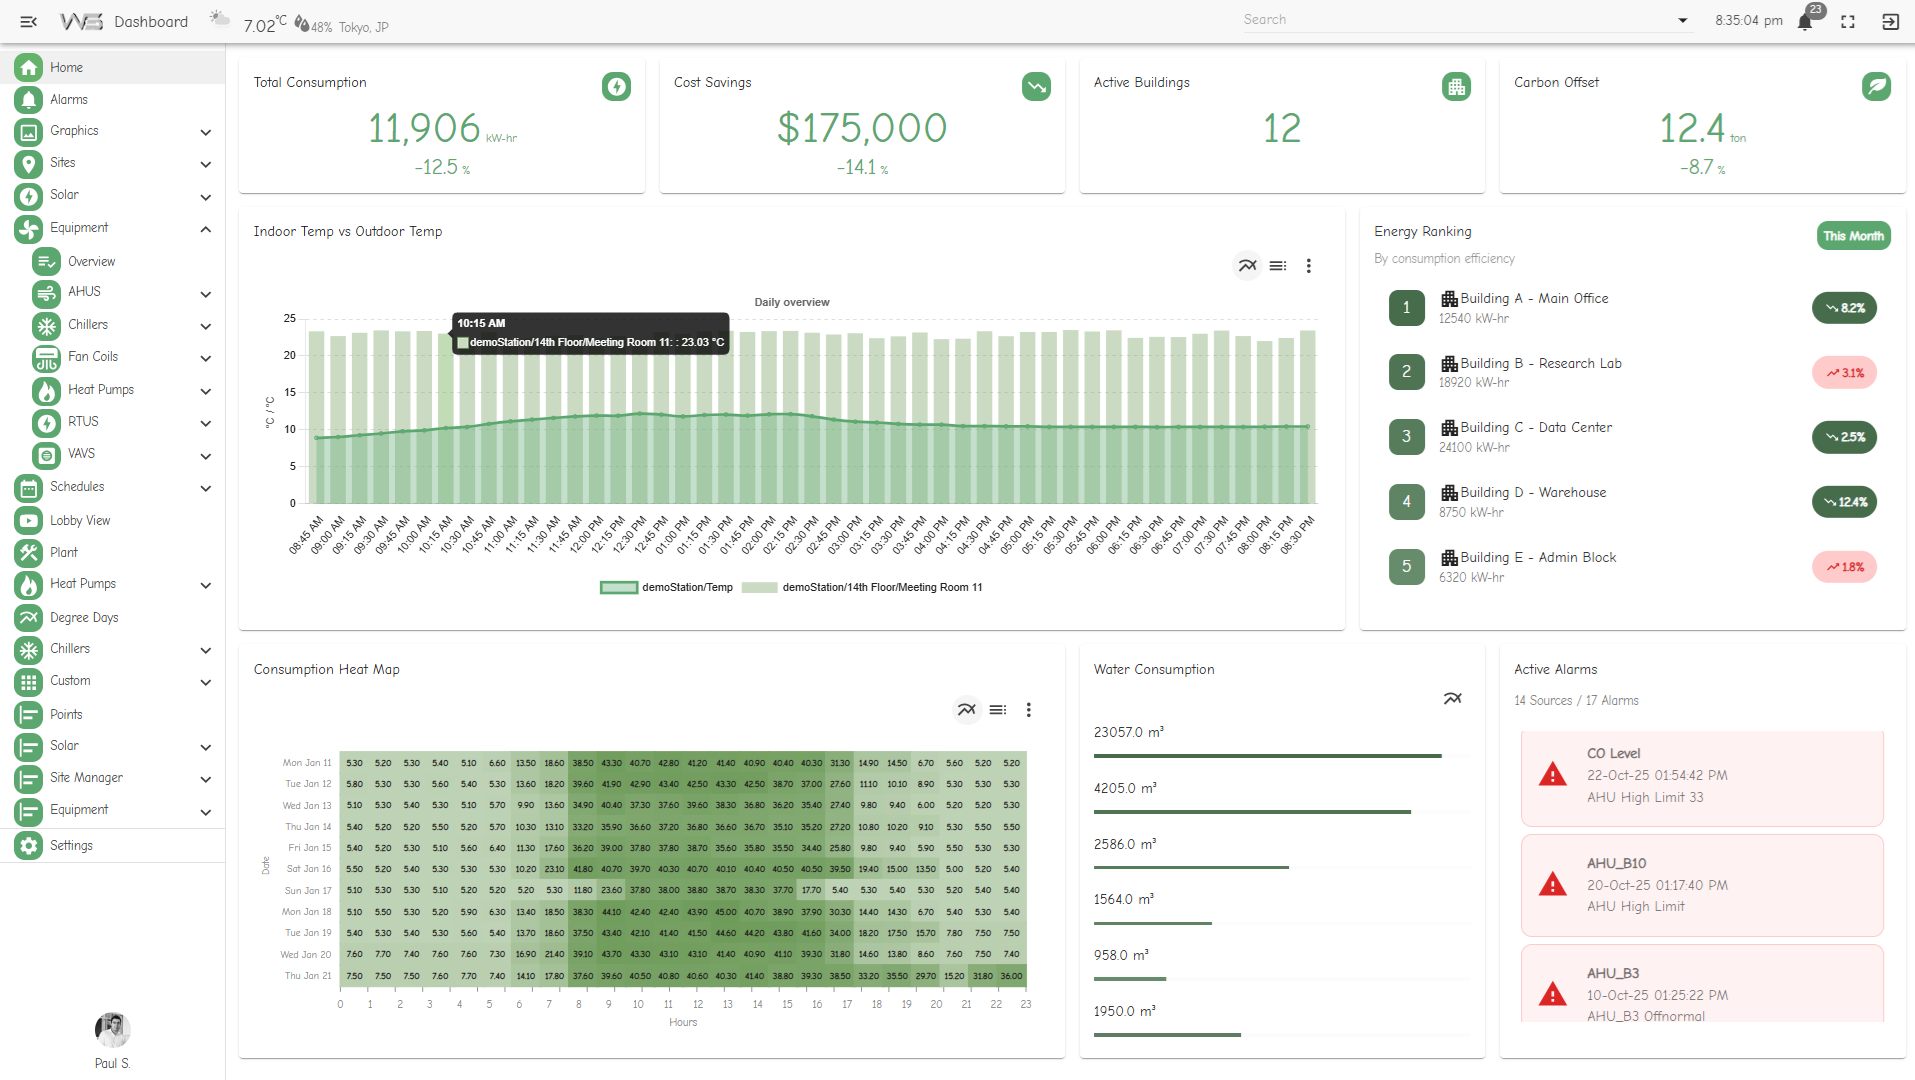
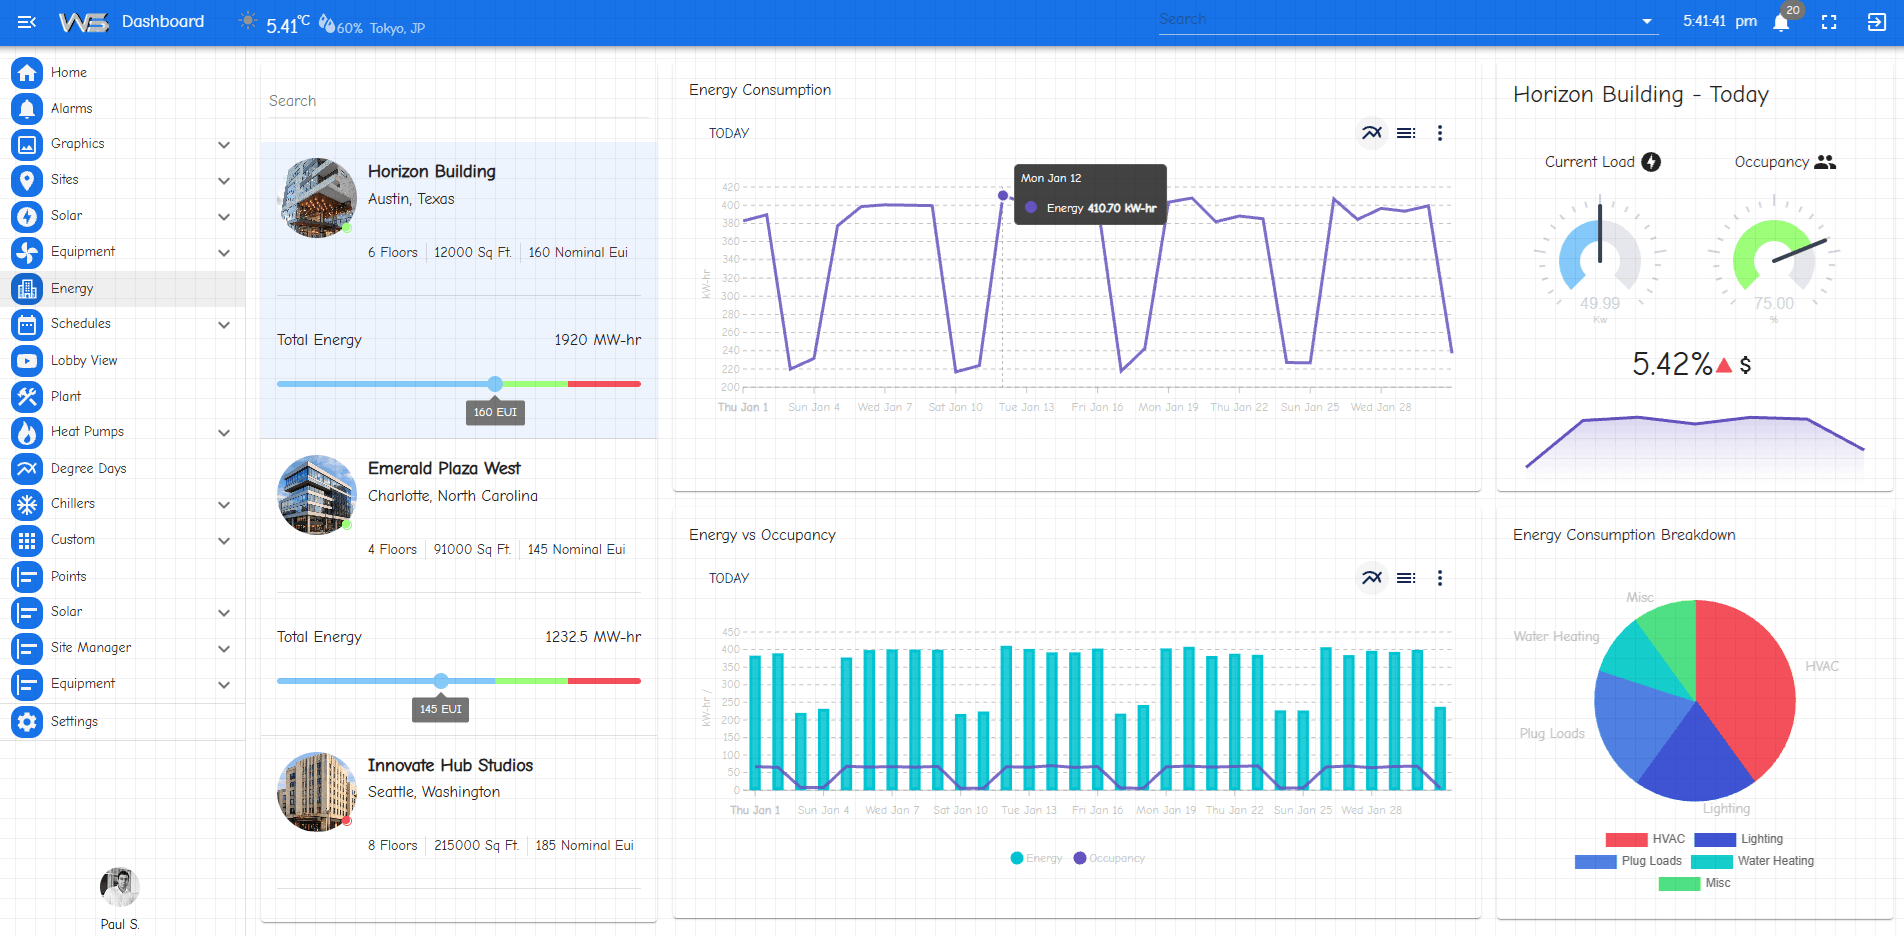
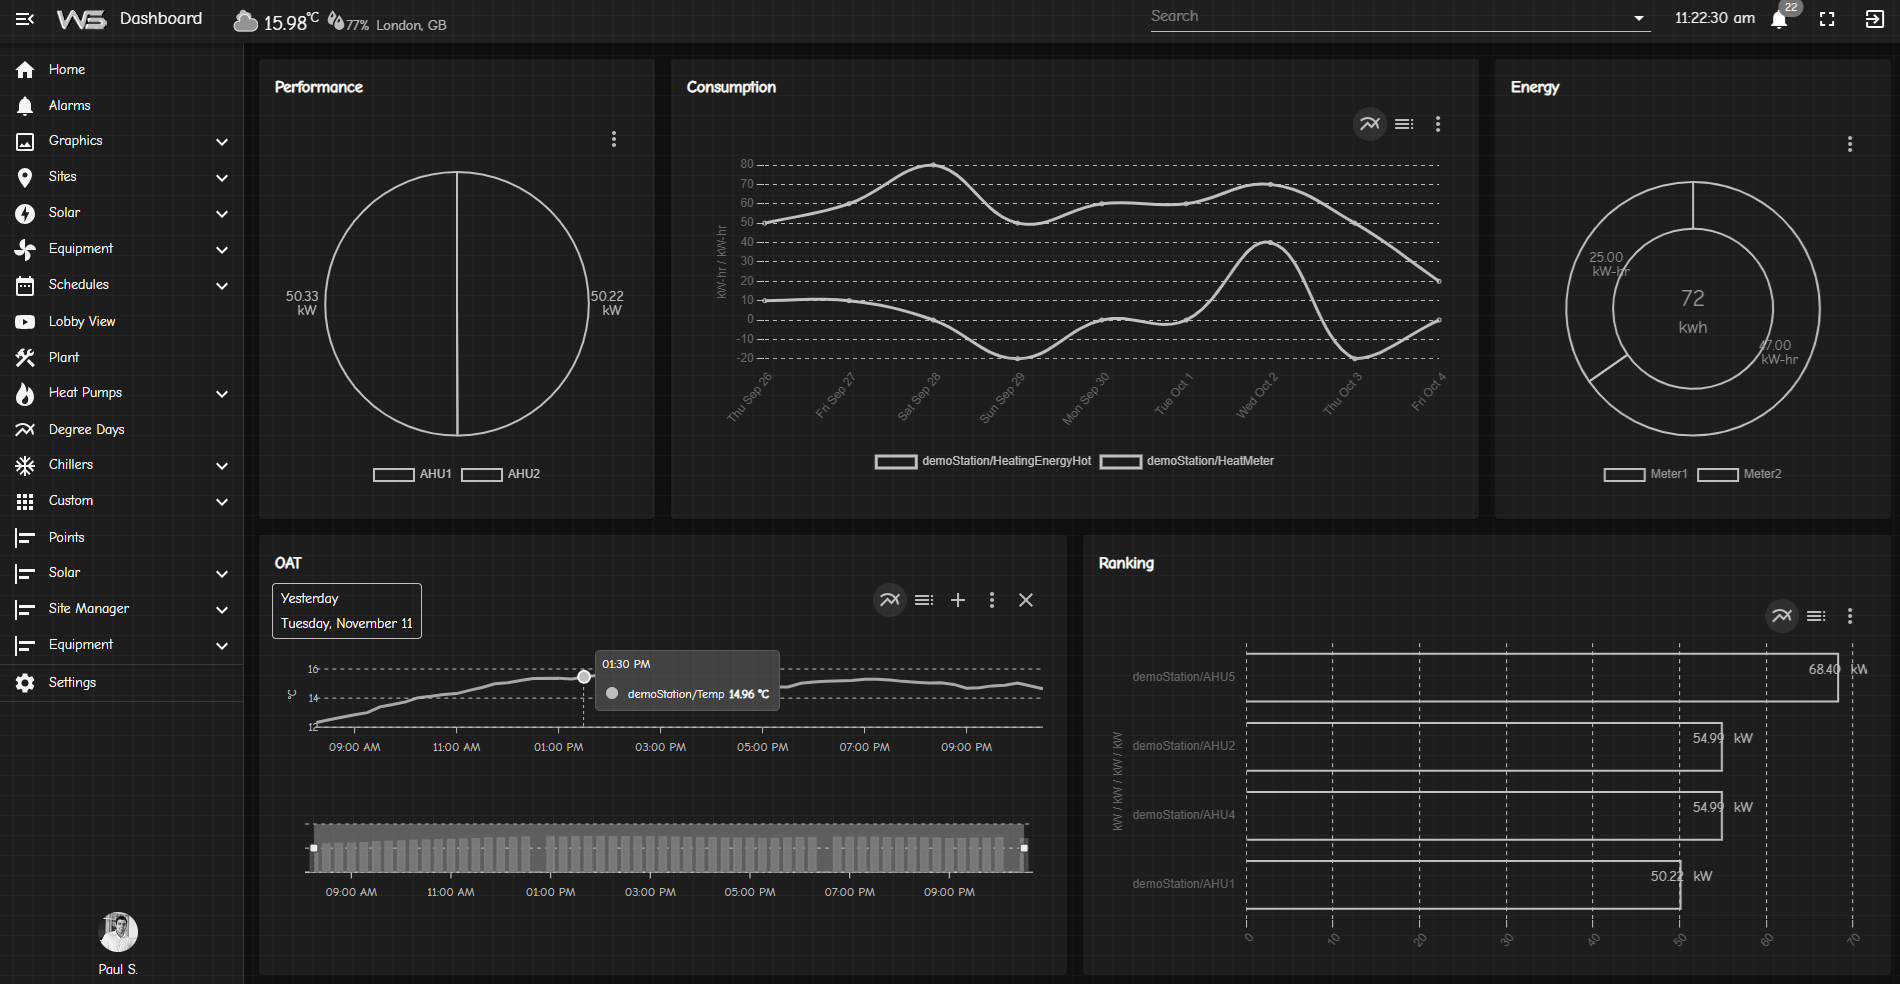
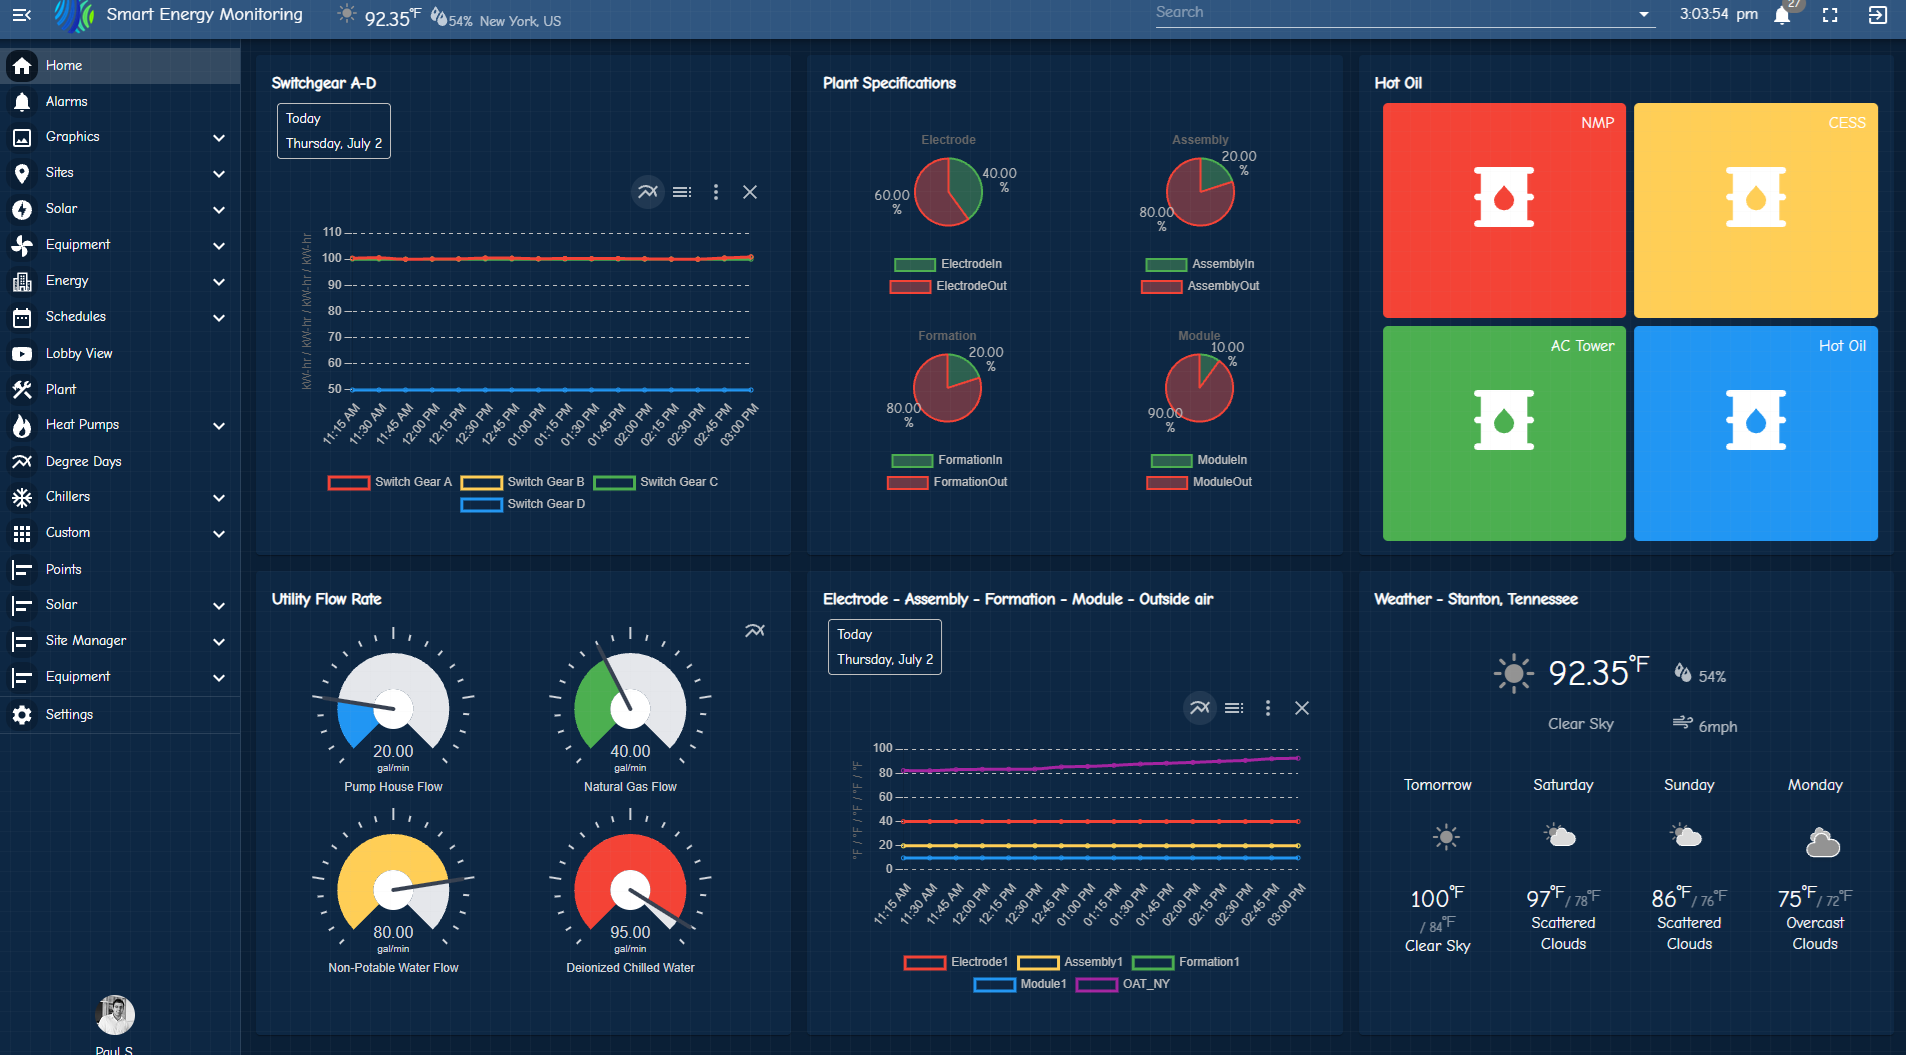
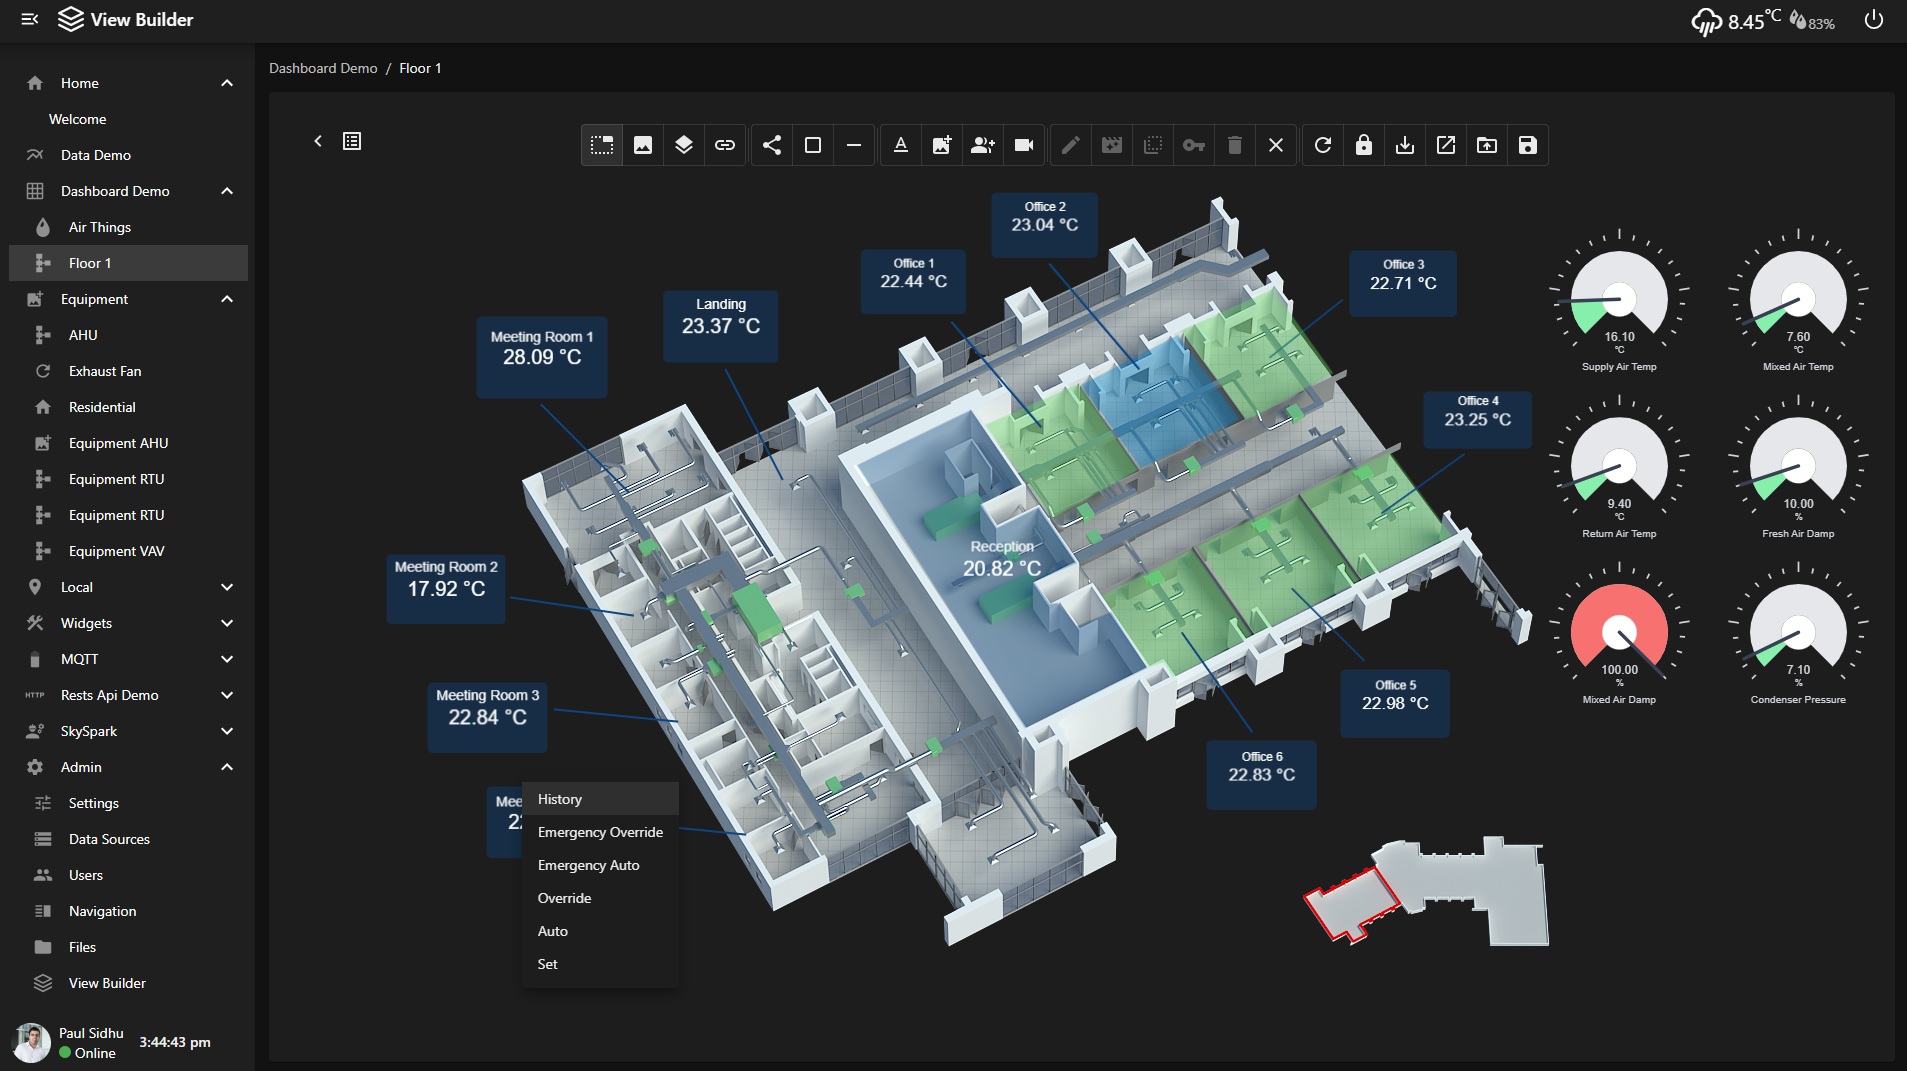
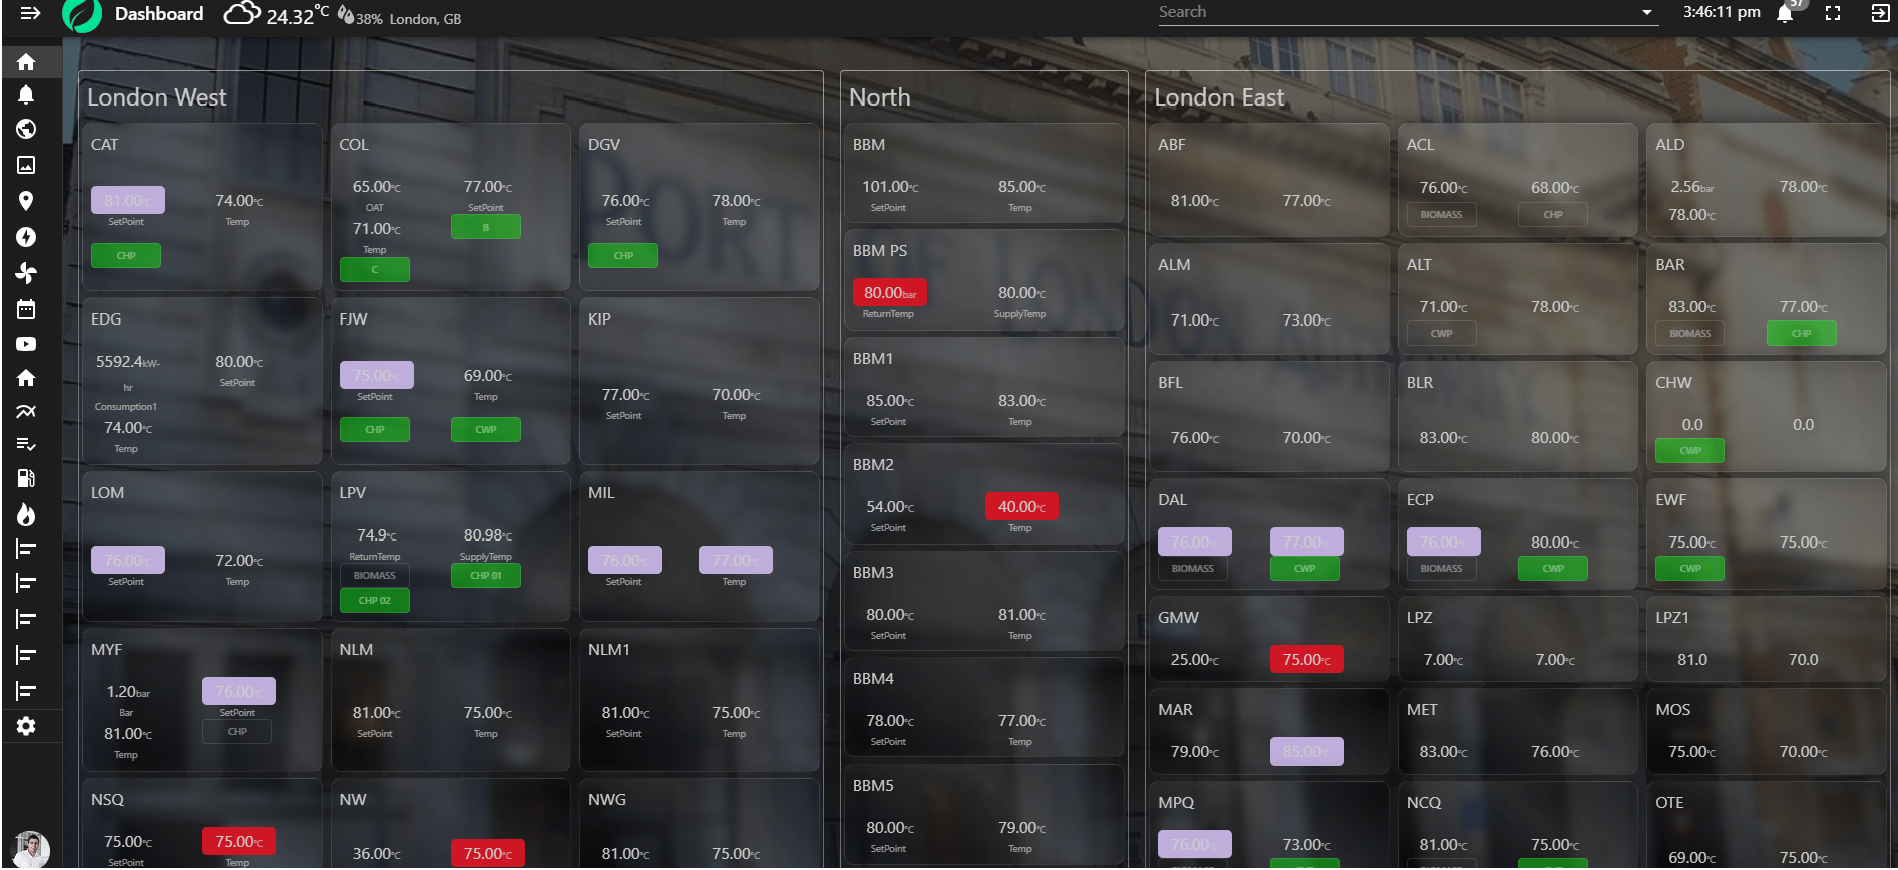
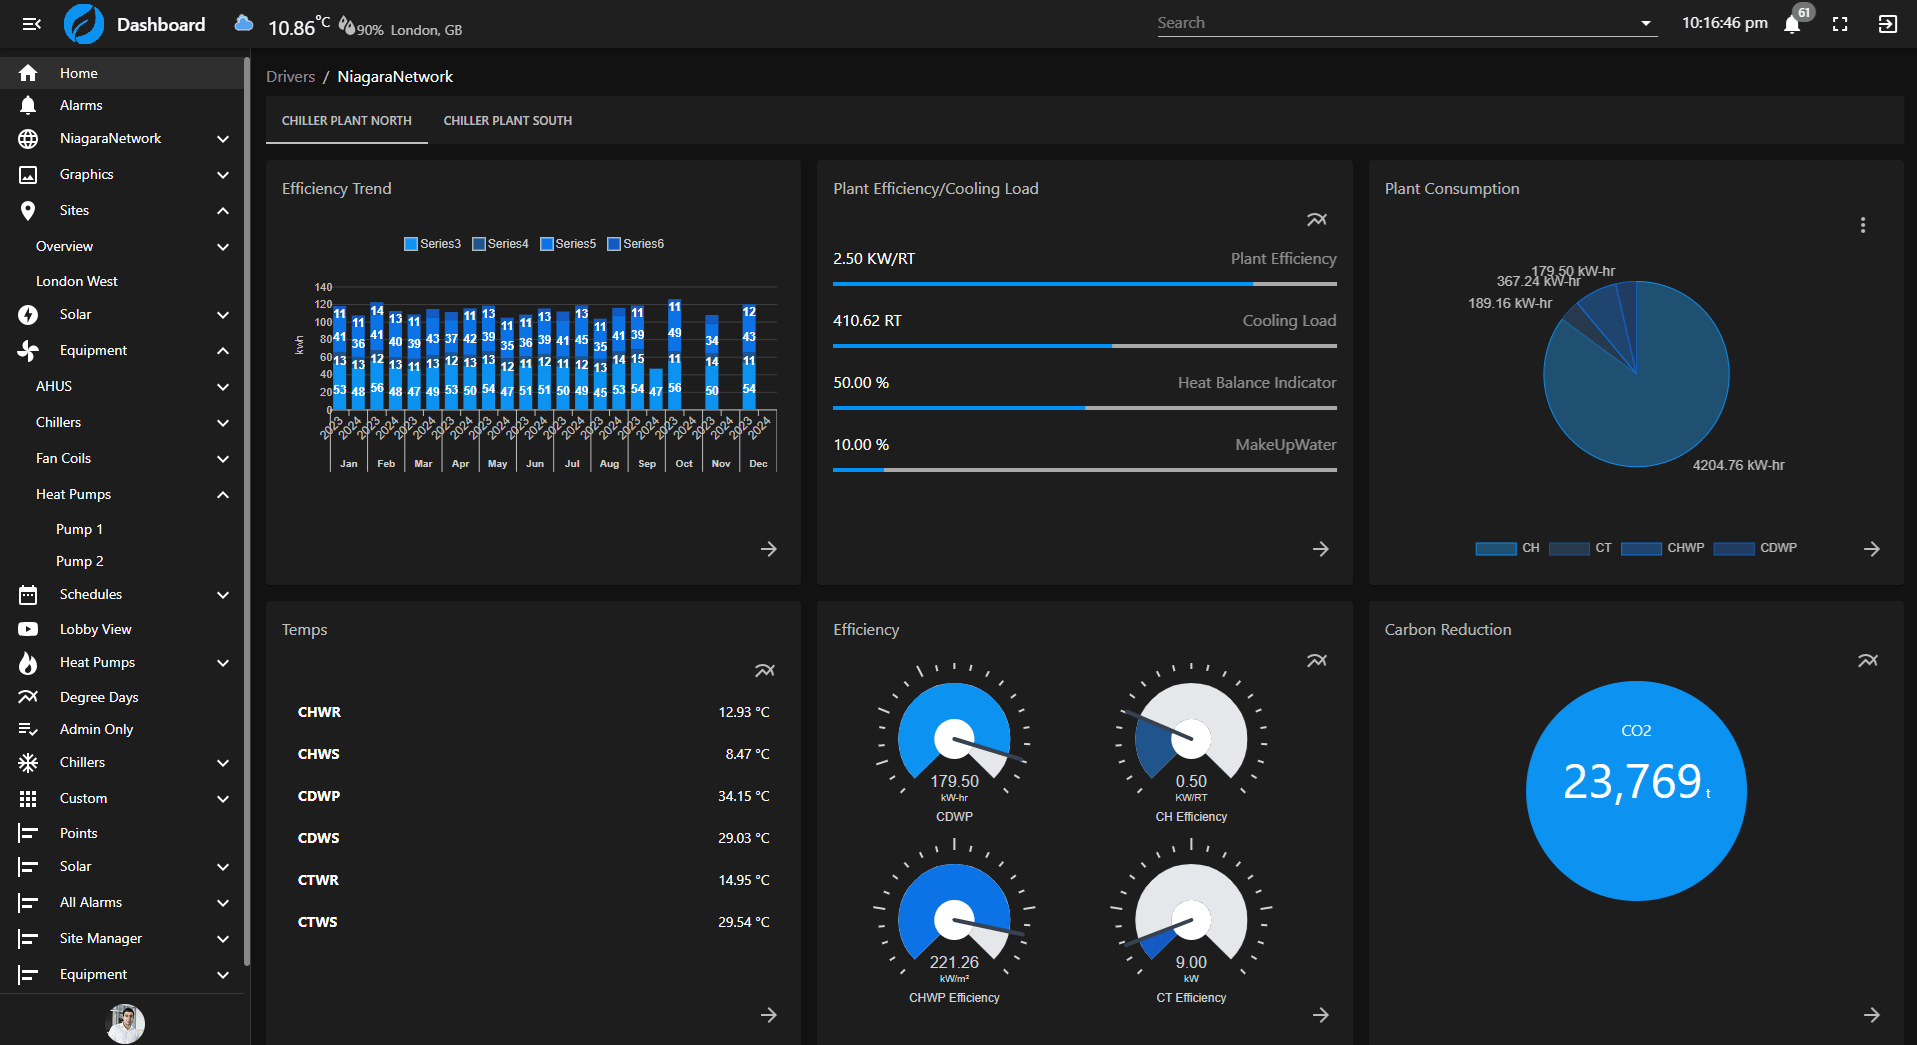
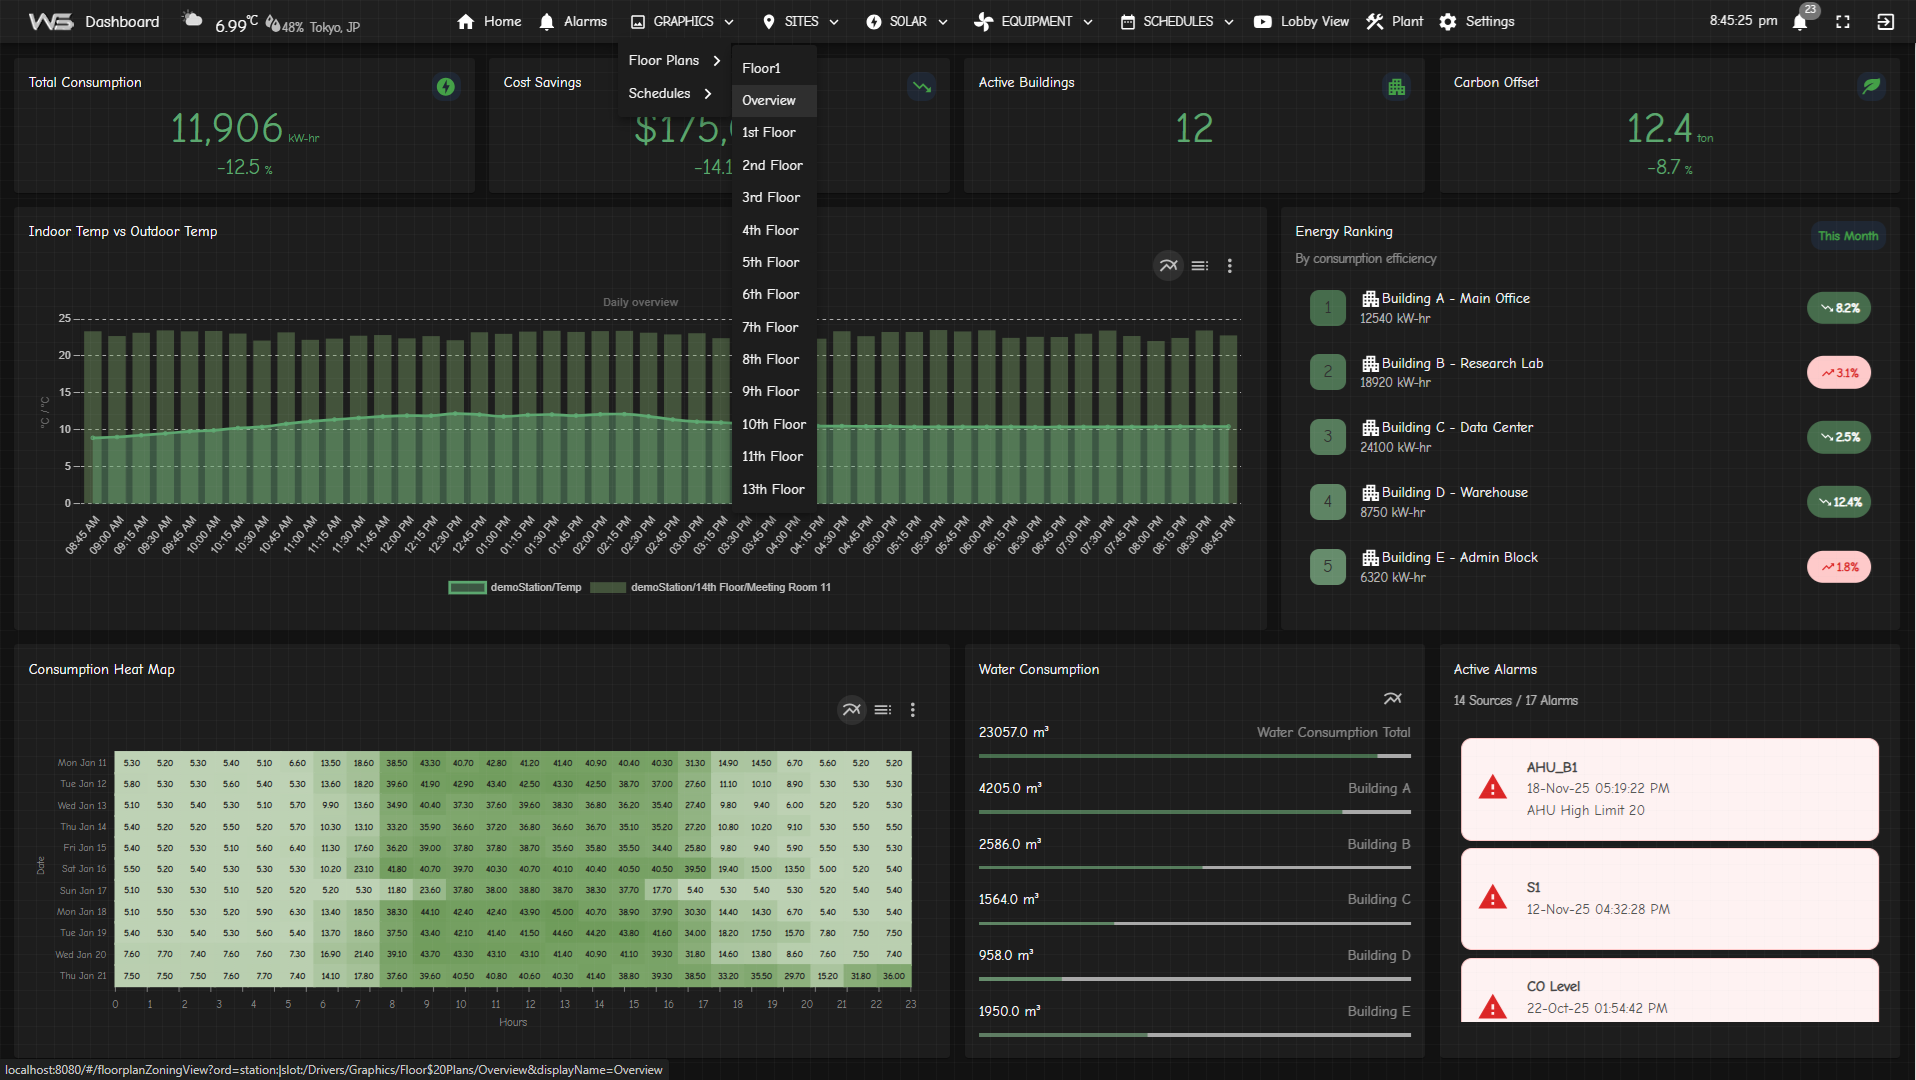
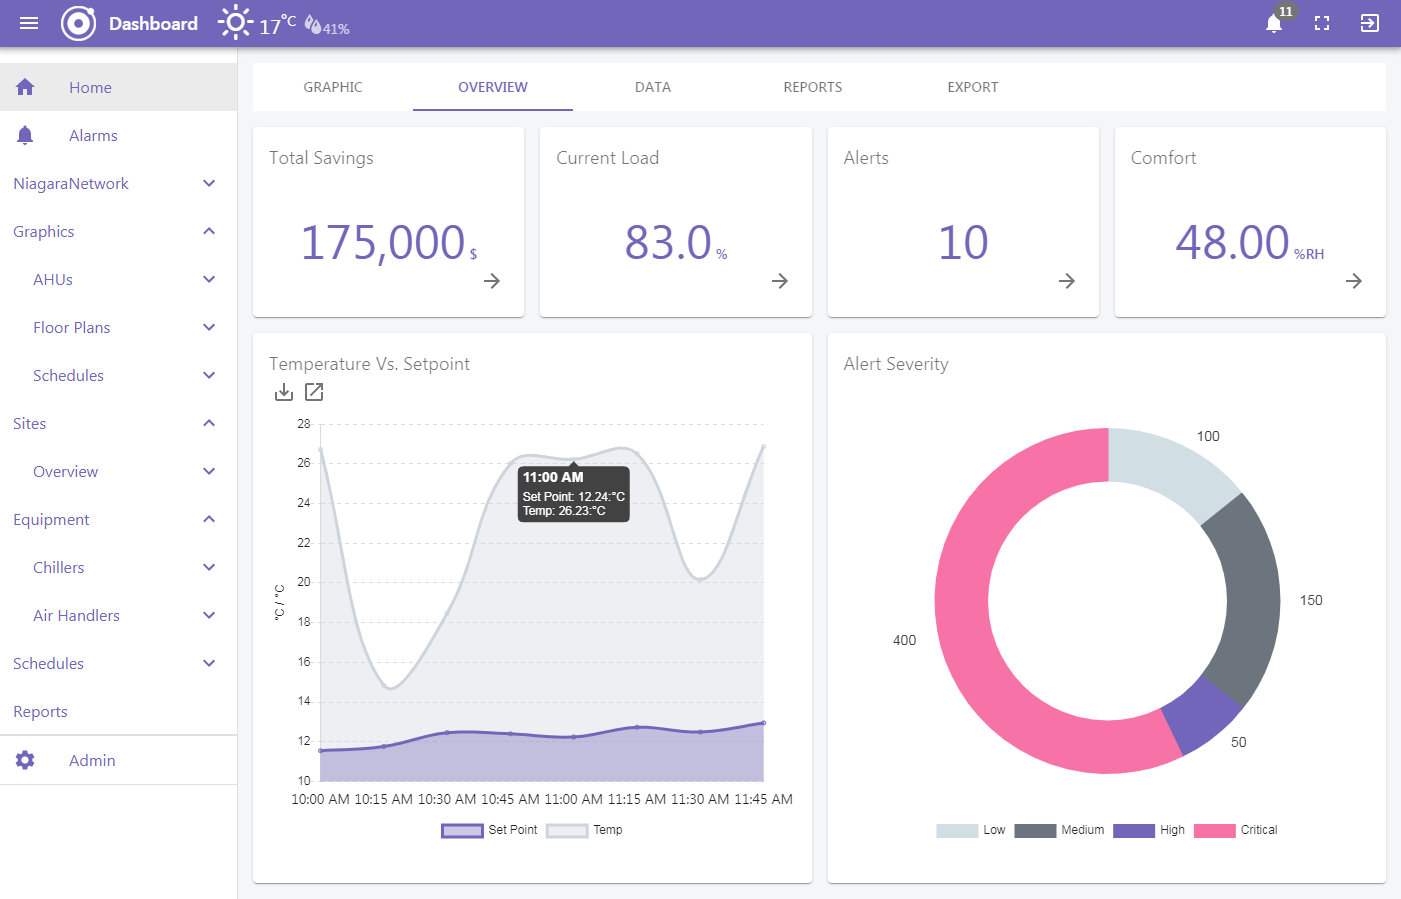
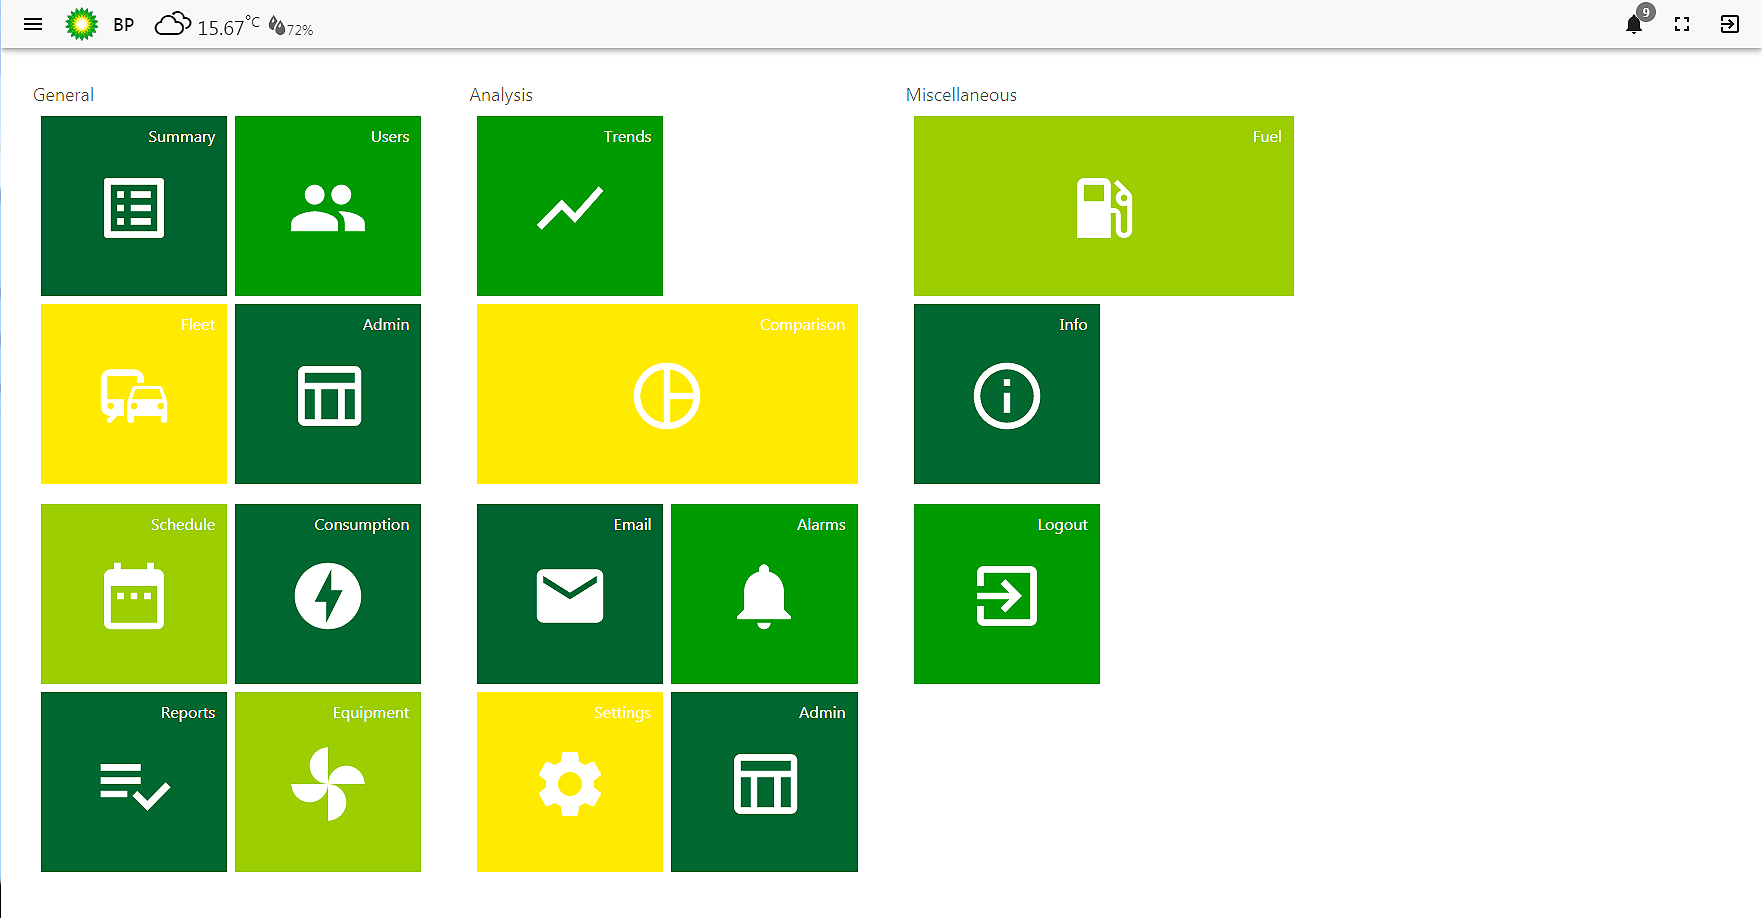
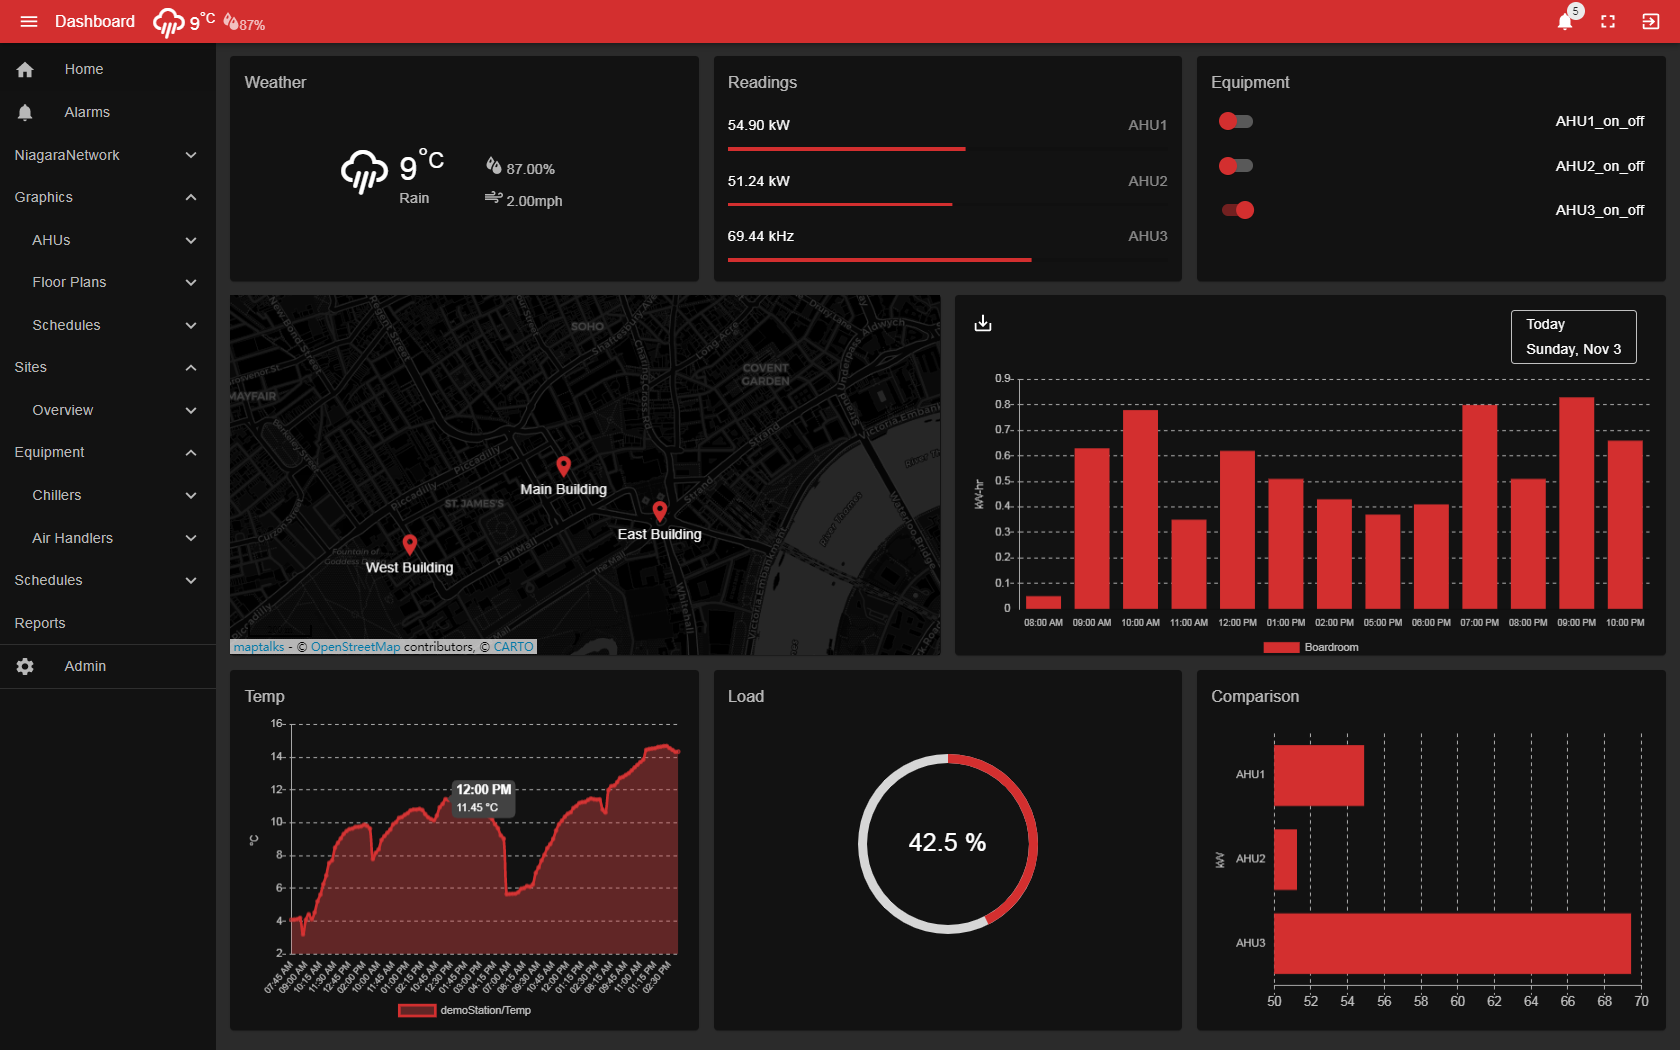
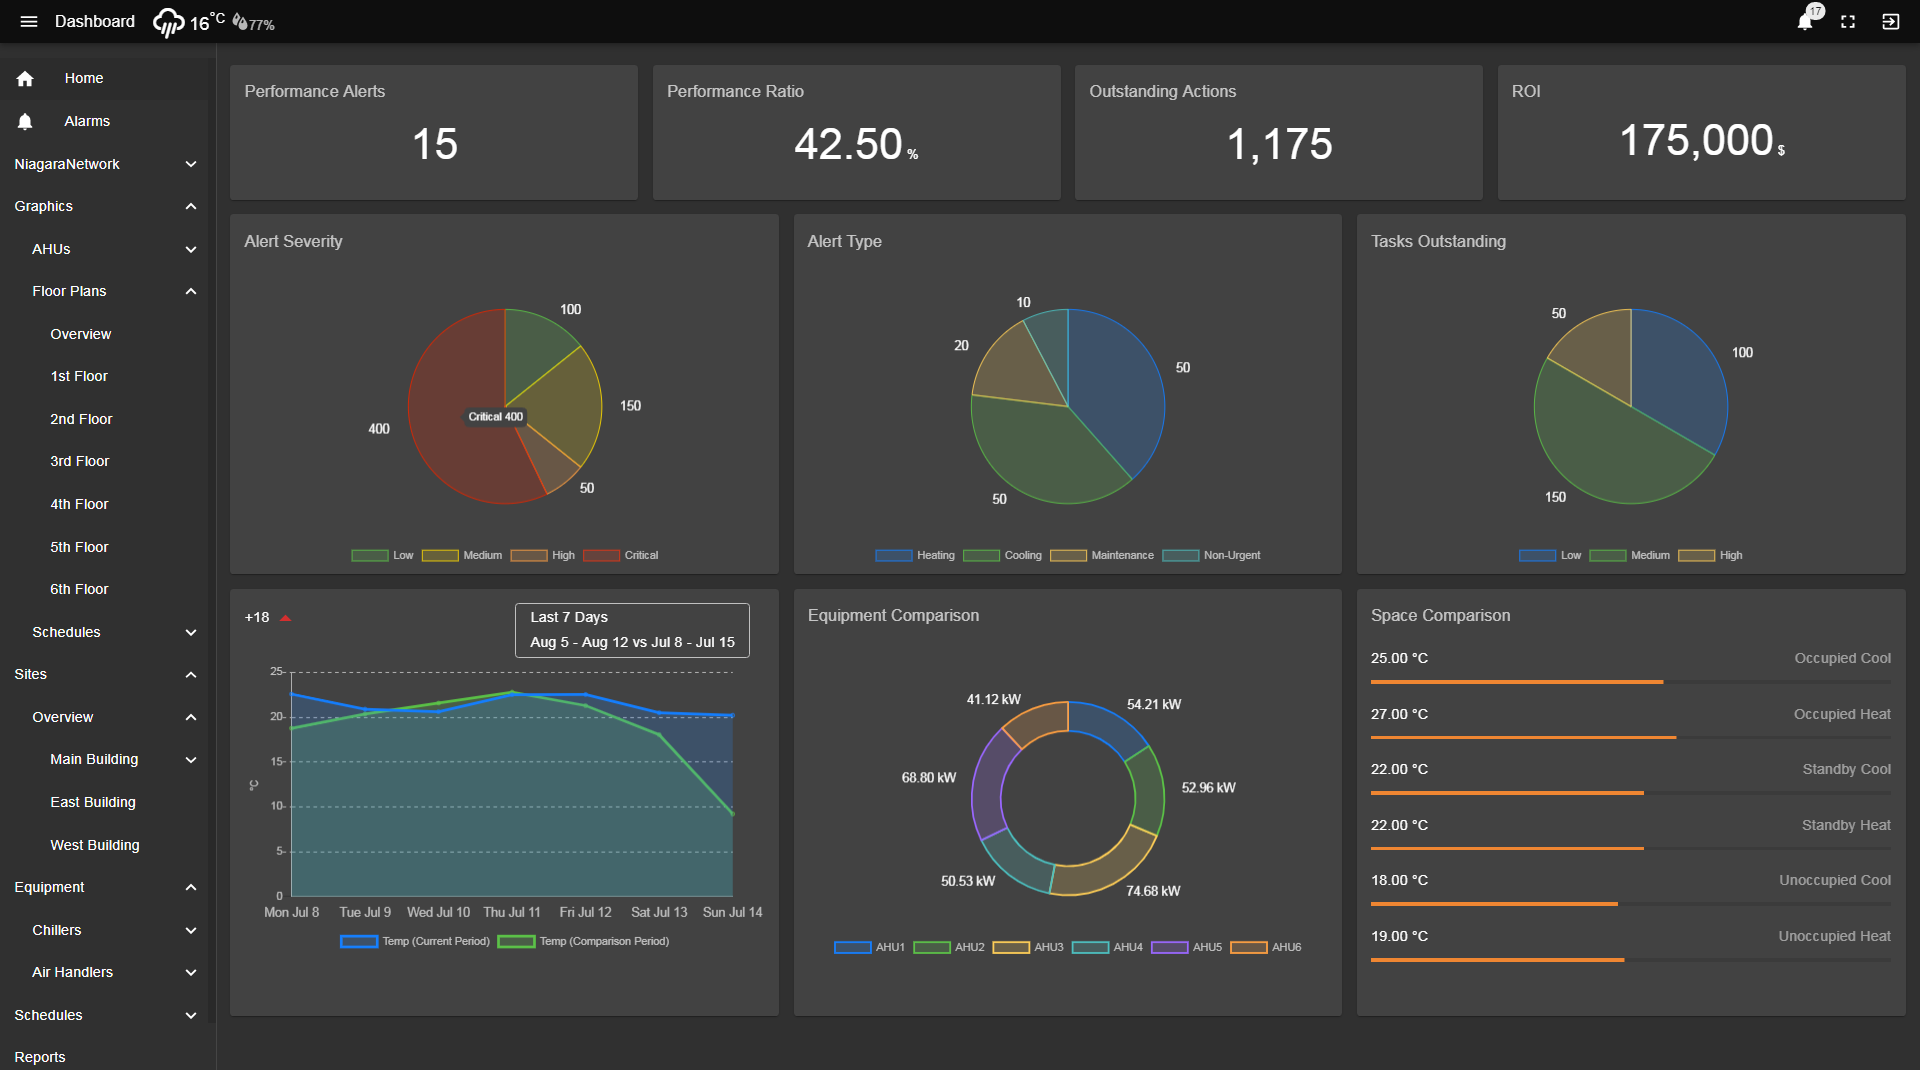
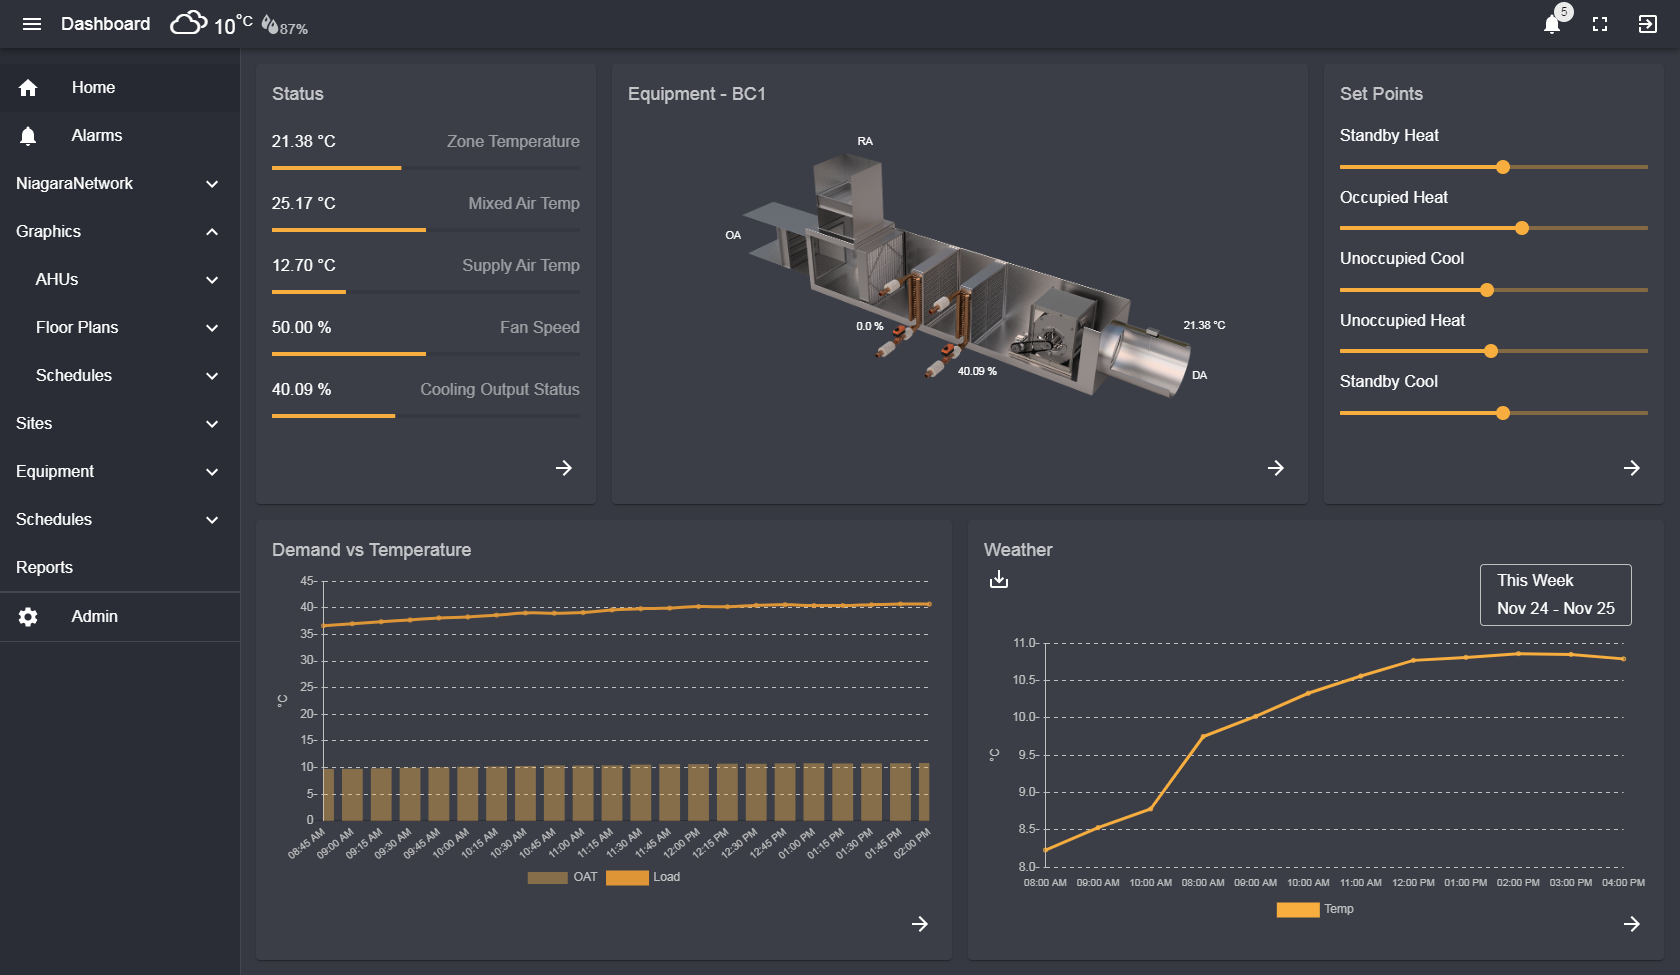
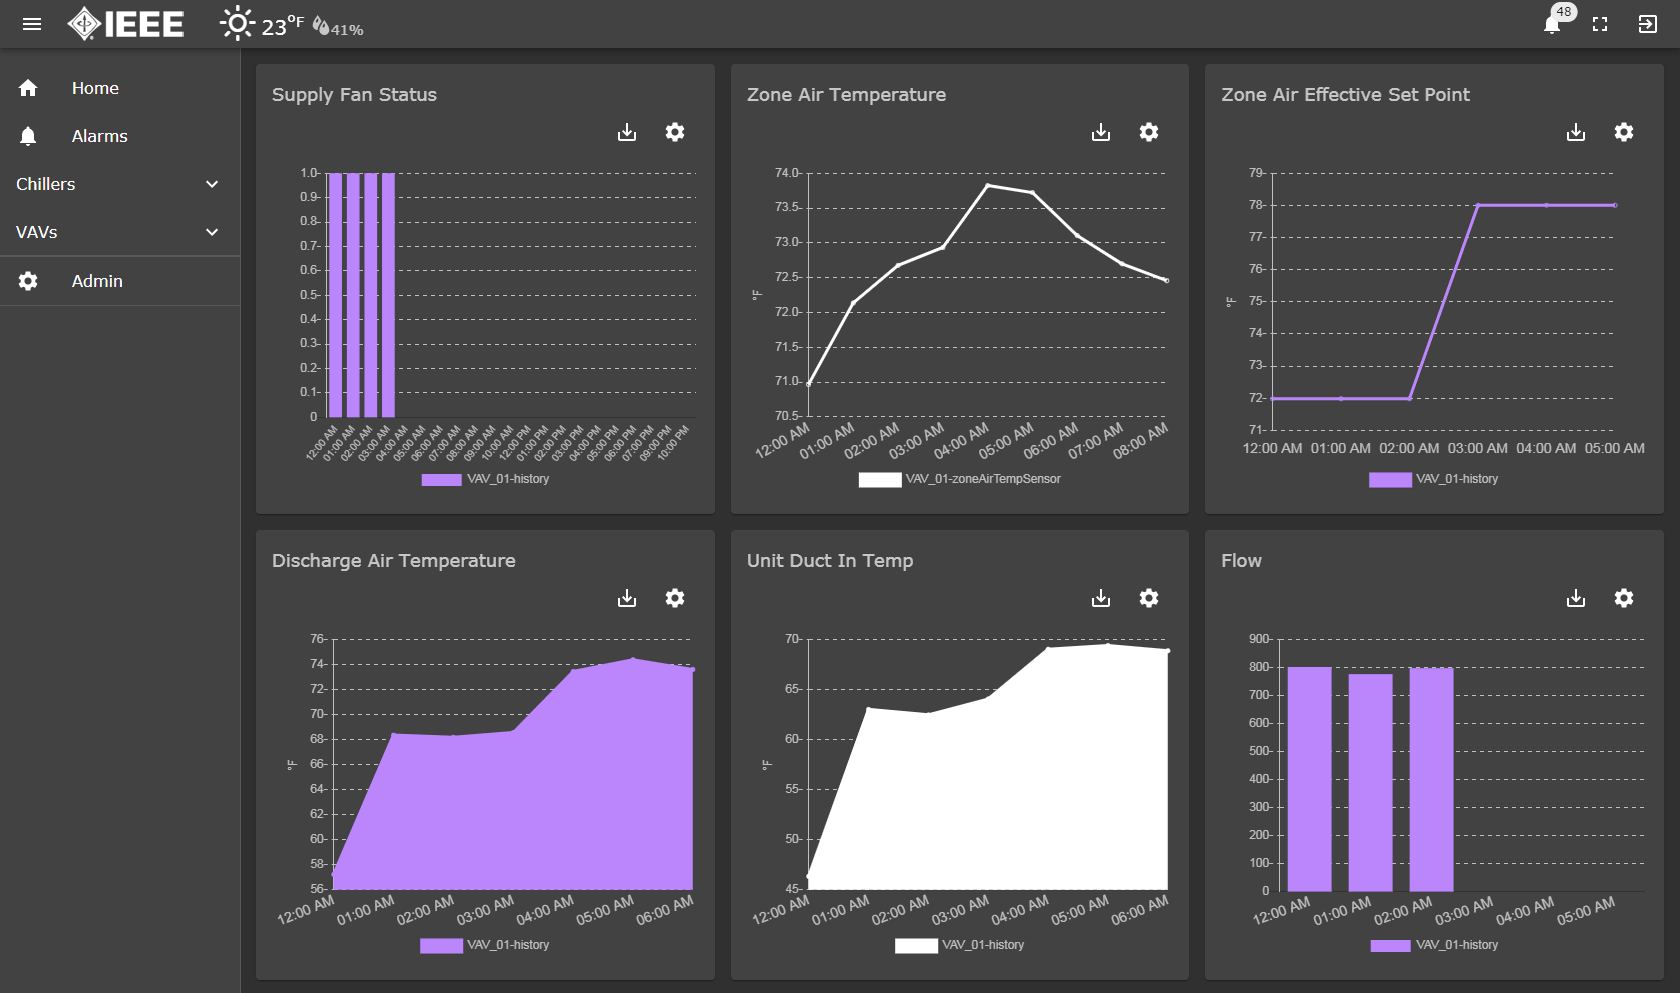
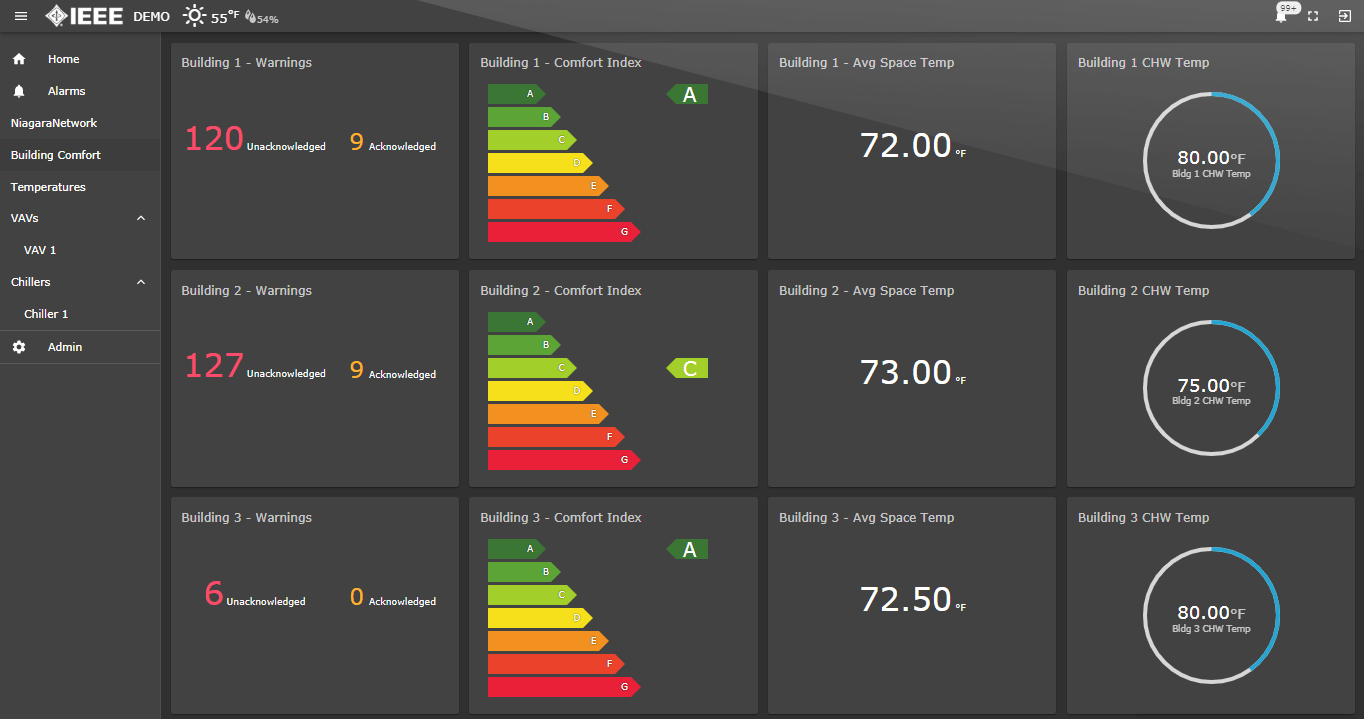
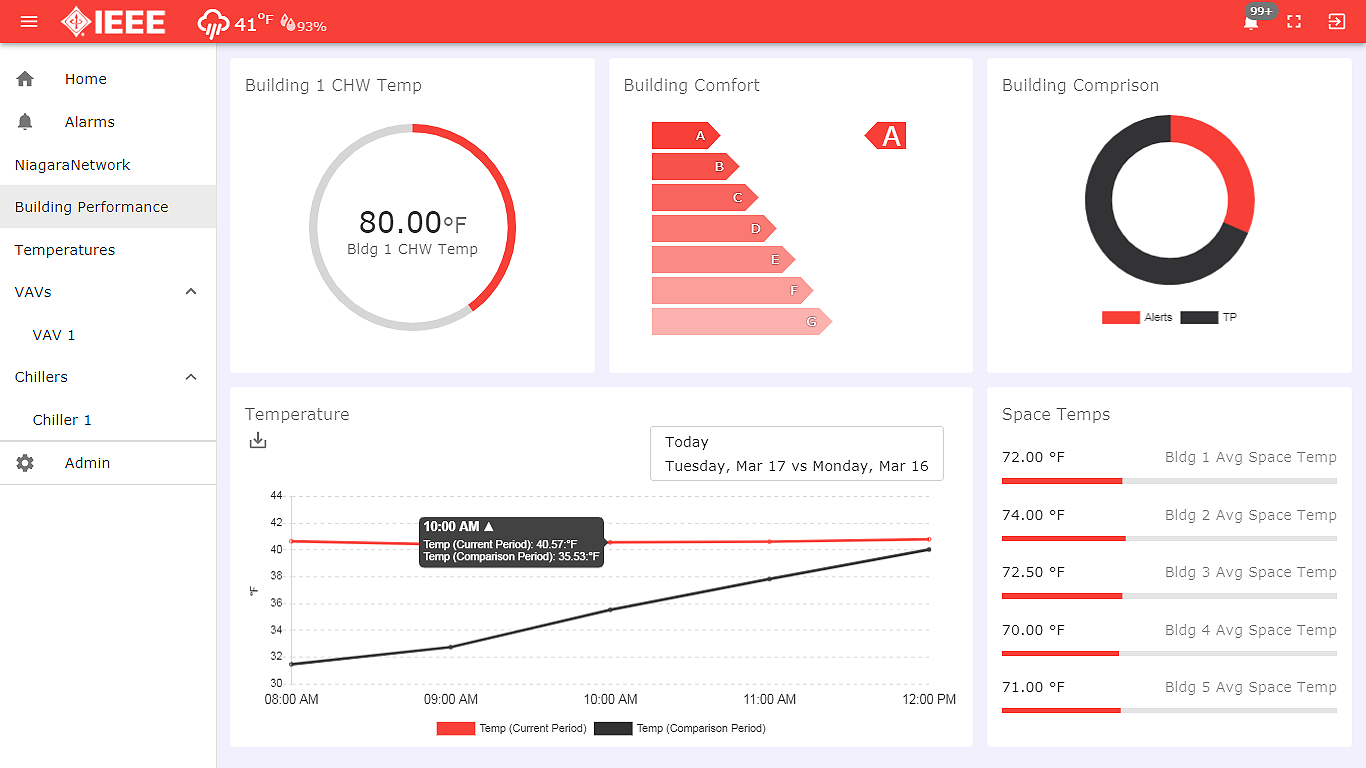
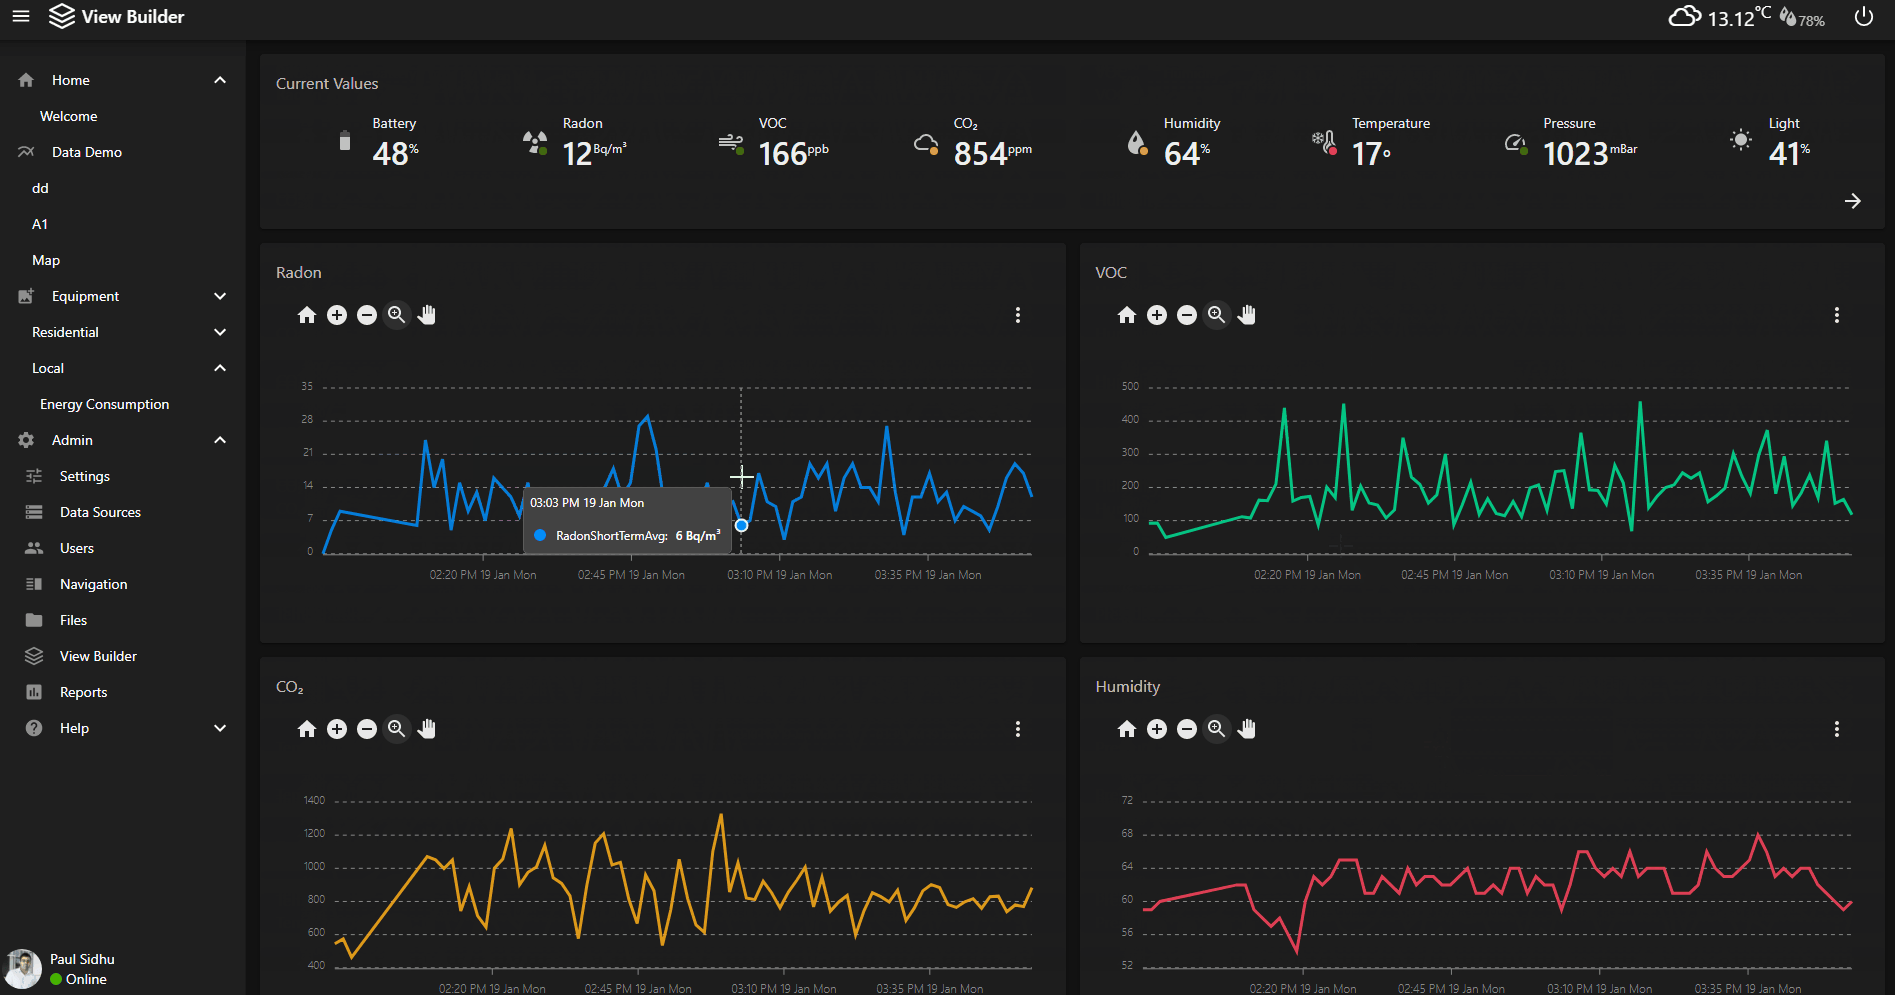
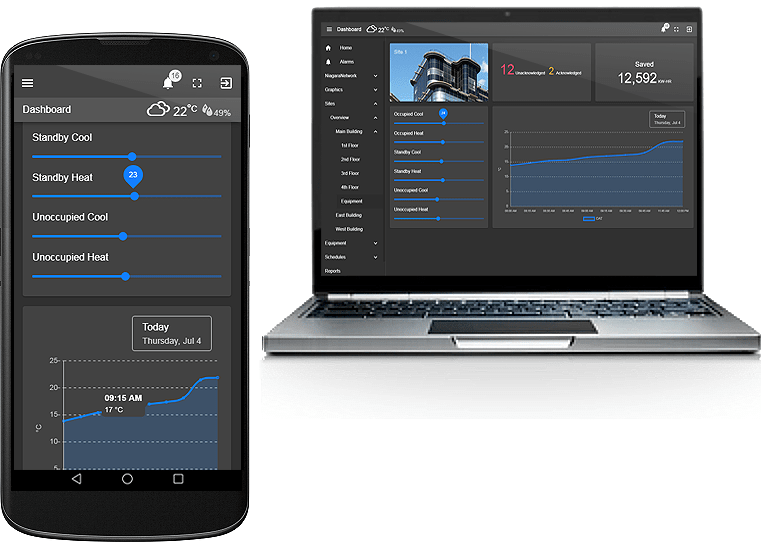
N4 View Builder™©️ allows you to build custom dashboards by dragging n' dropping widgets into tab or grid style interface.
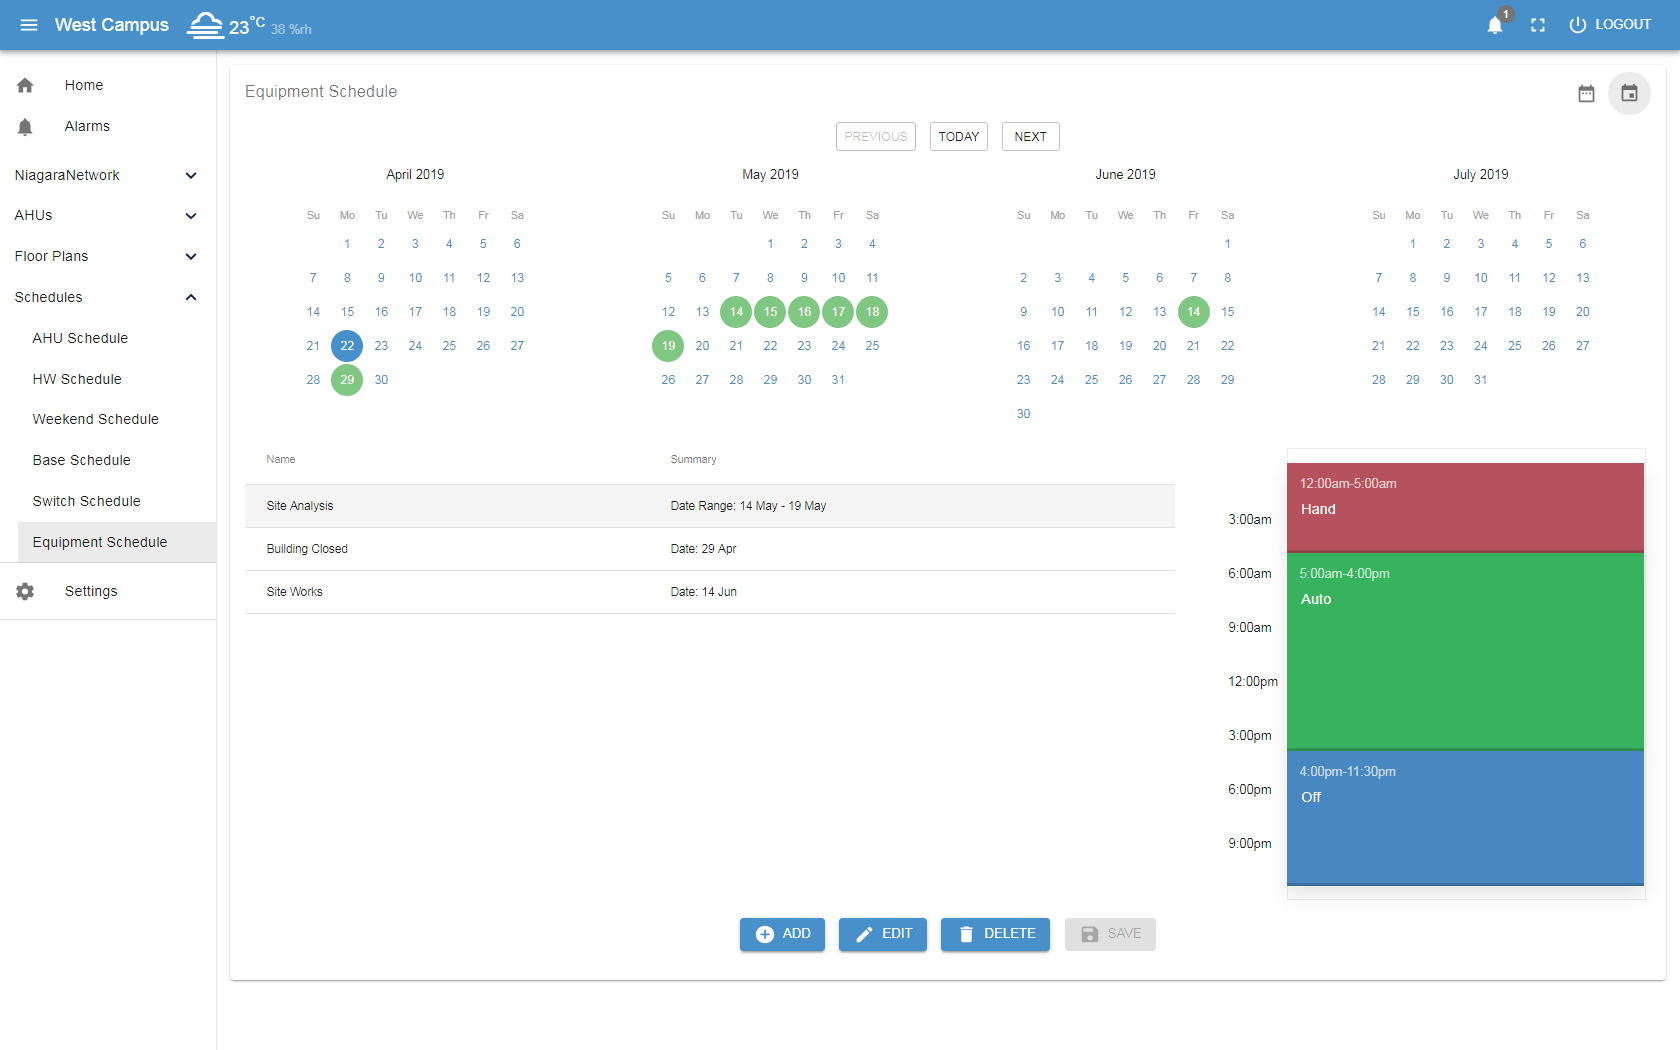
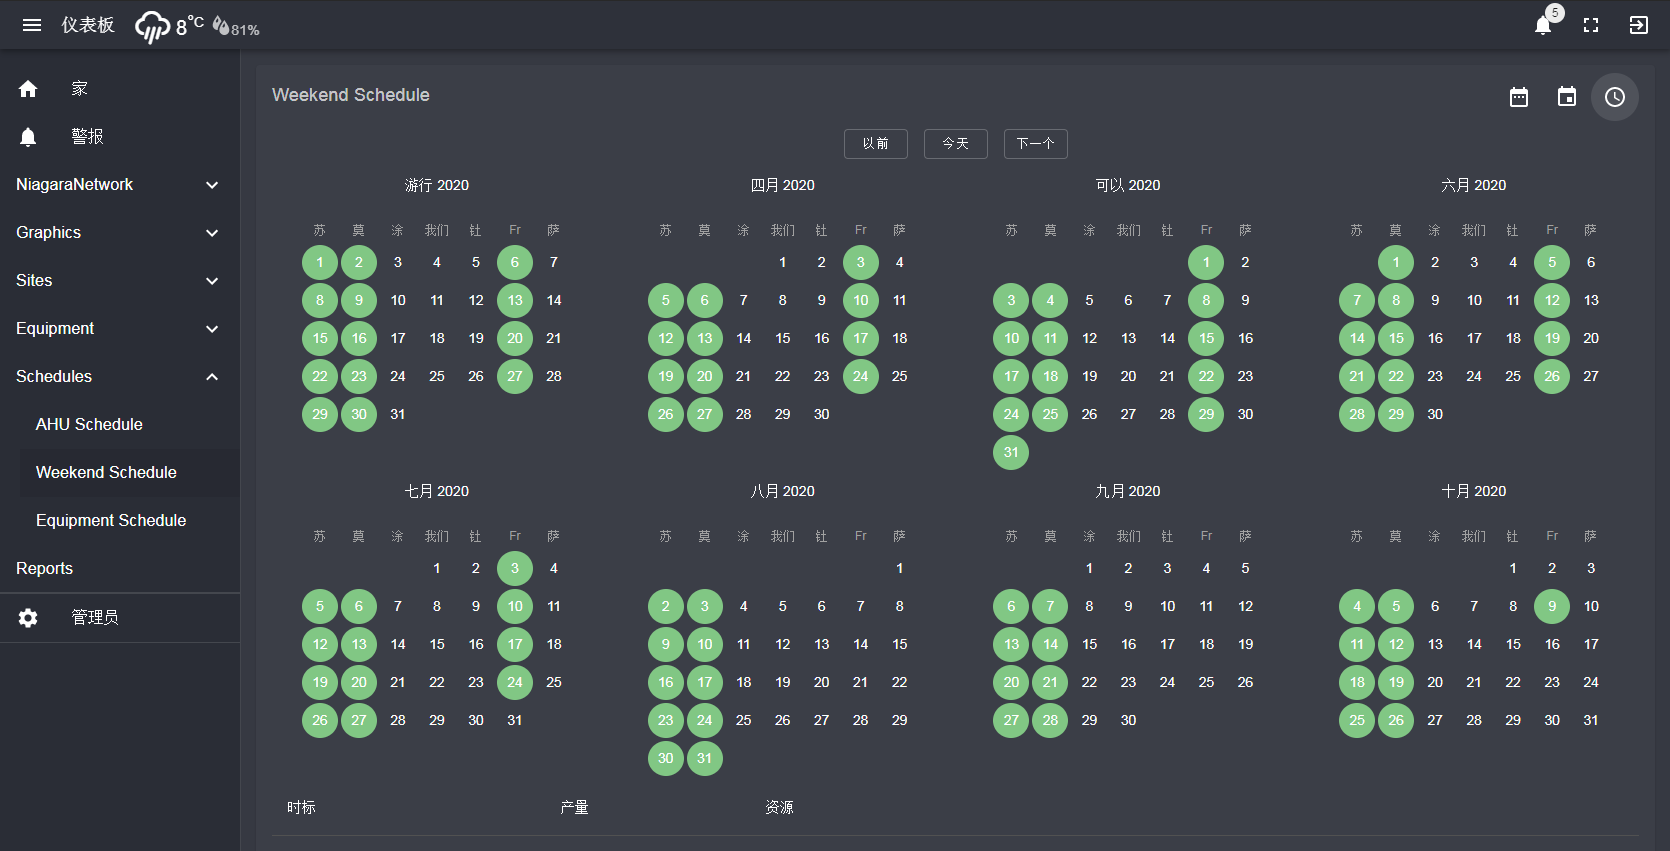
This product also includes Scheduling View,
Energy View,
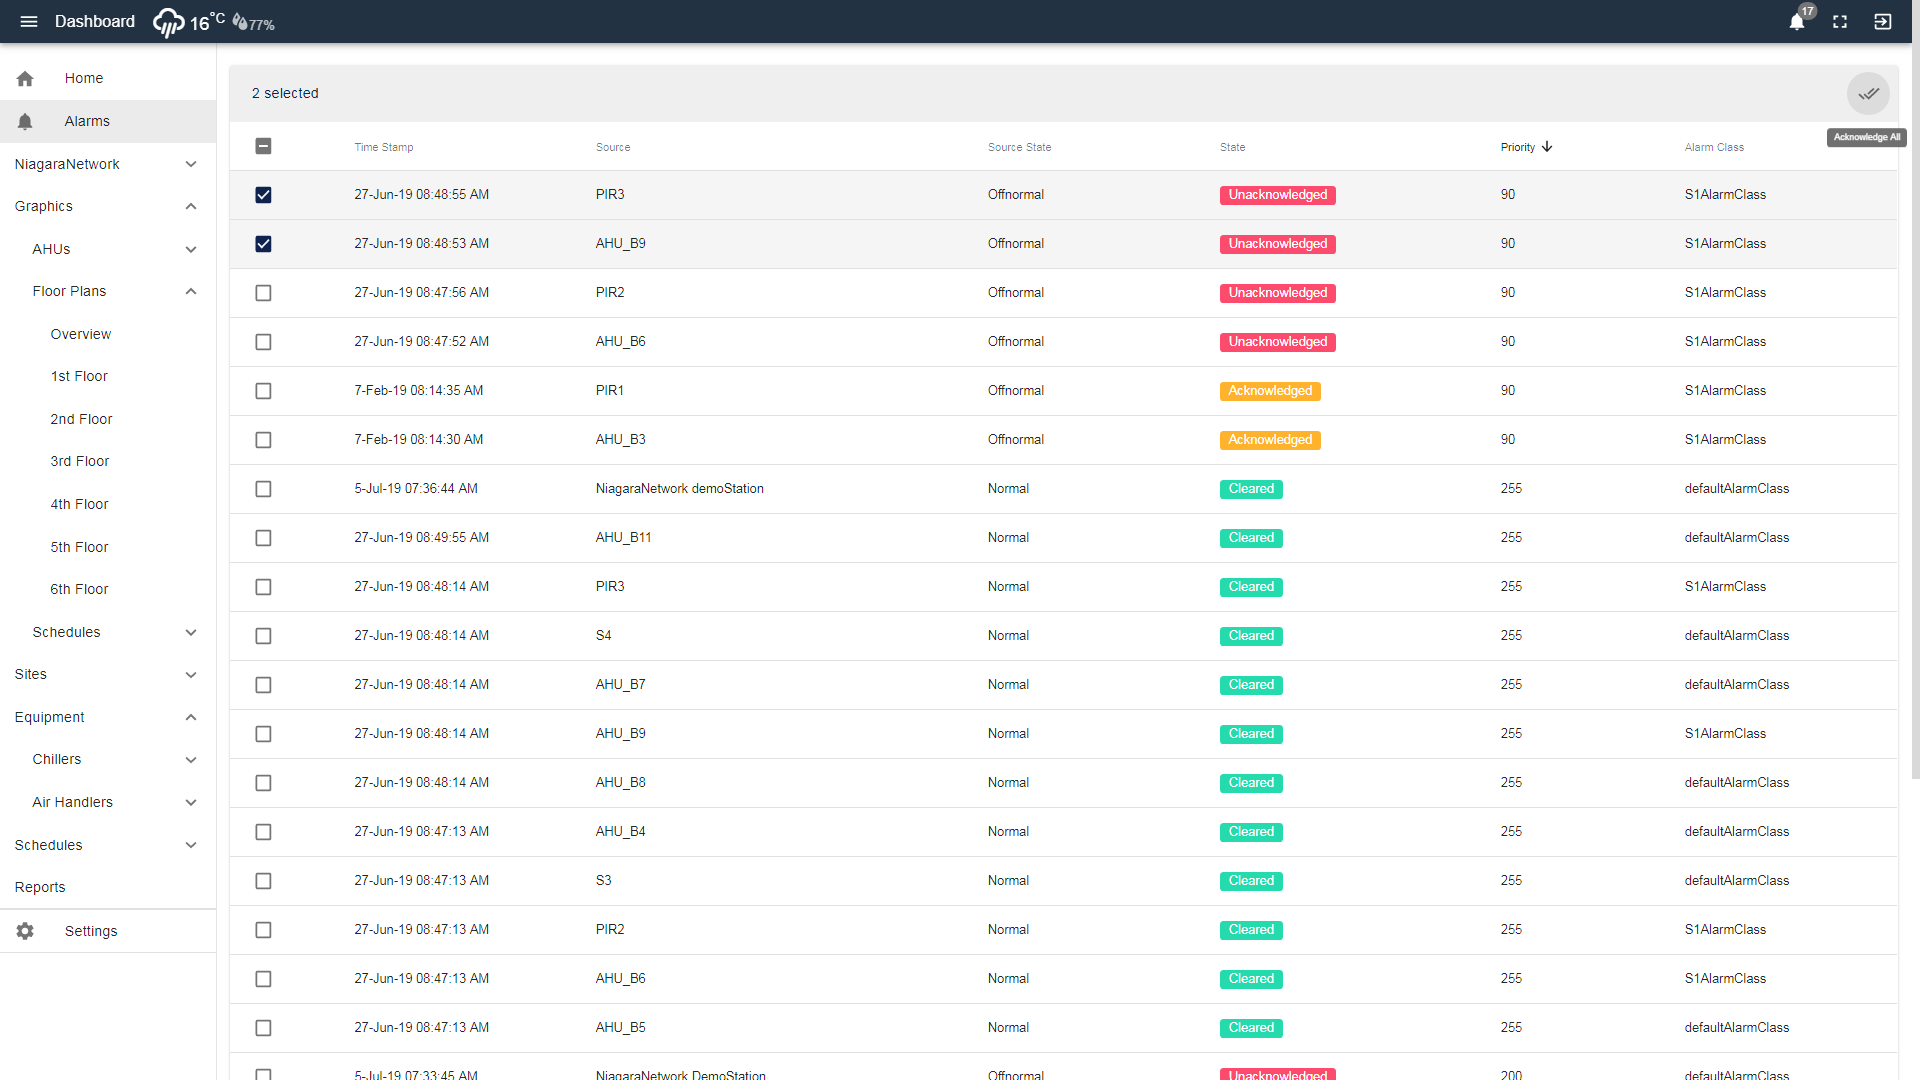
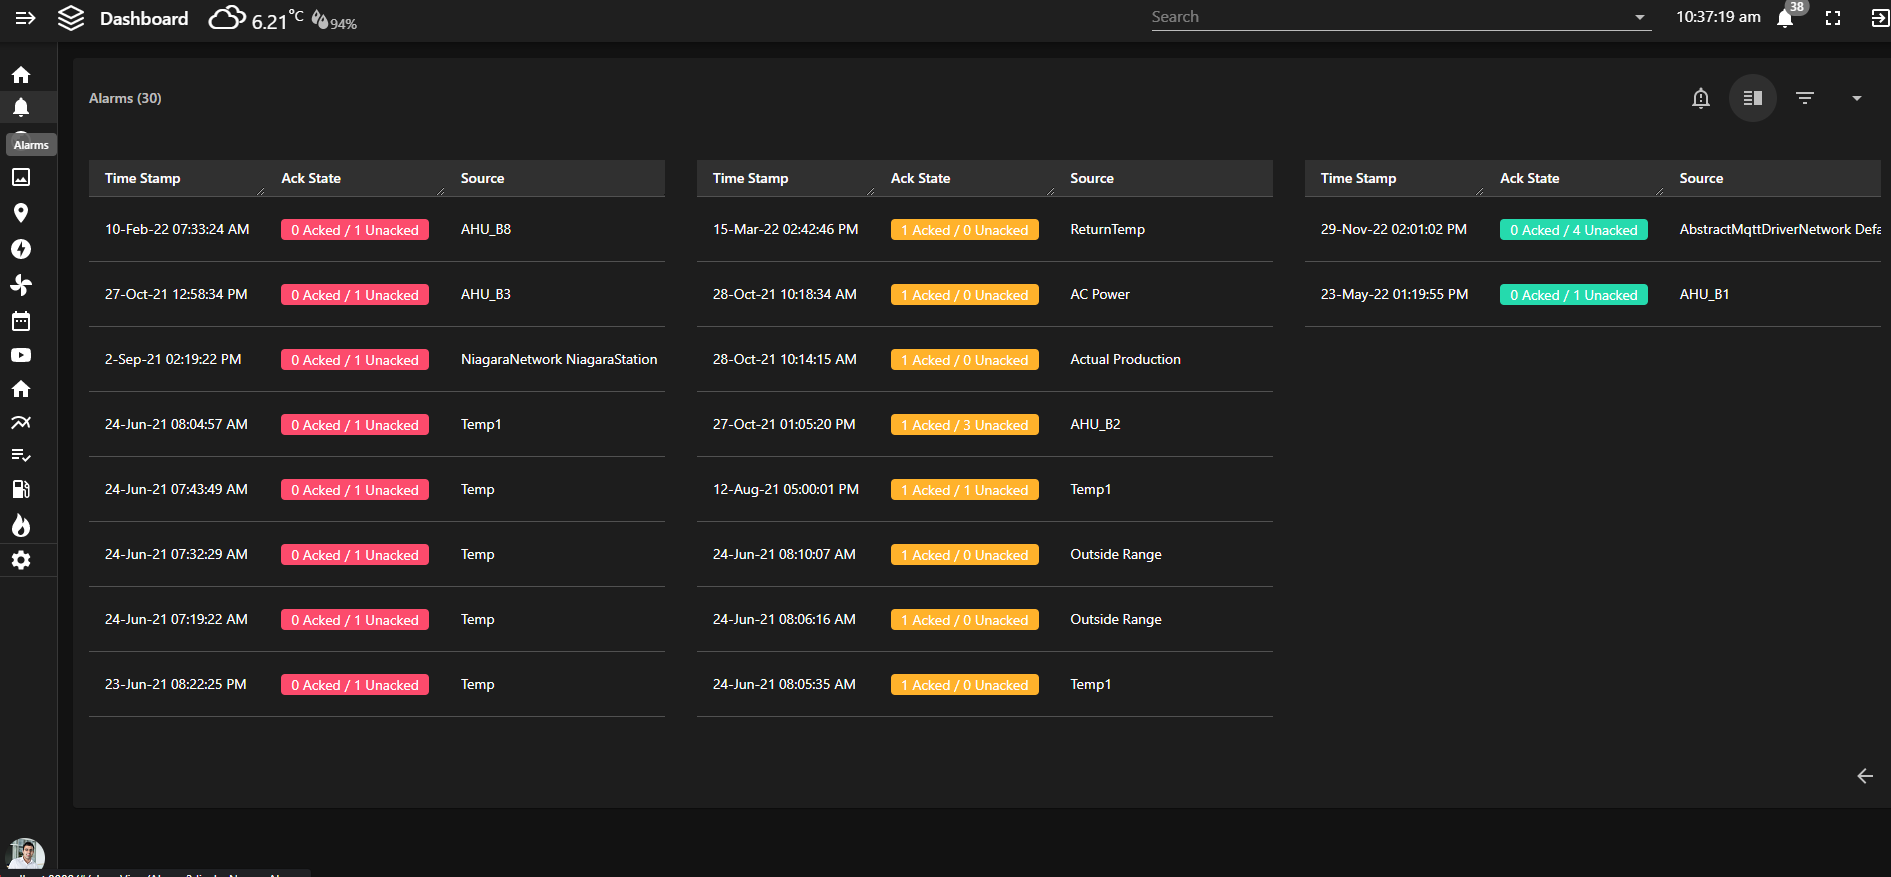
PX View, Alarm View,
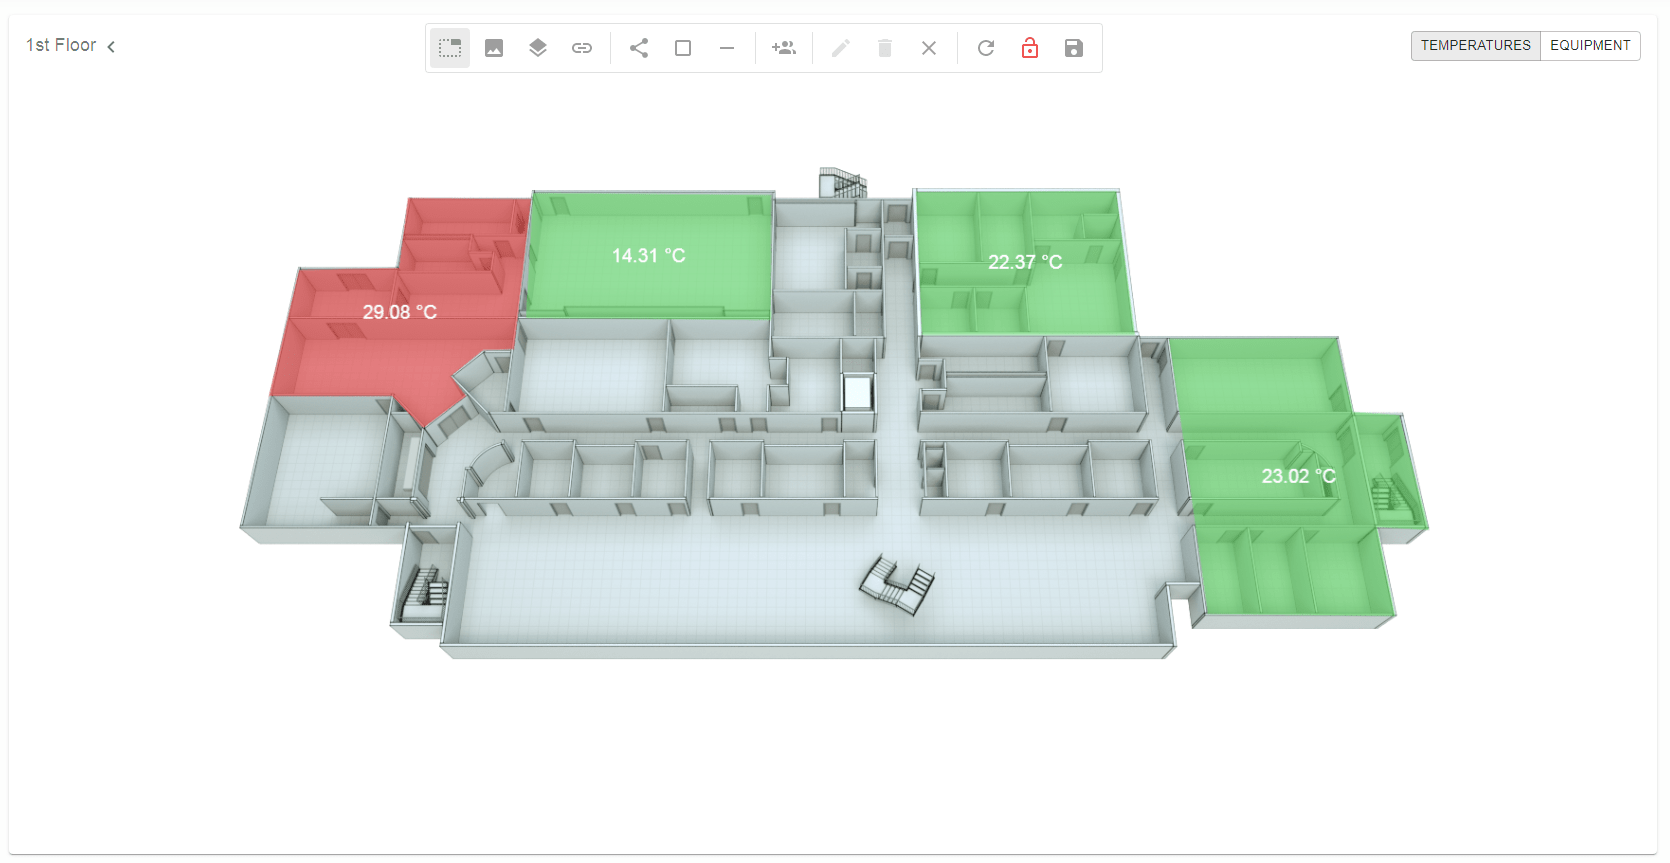
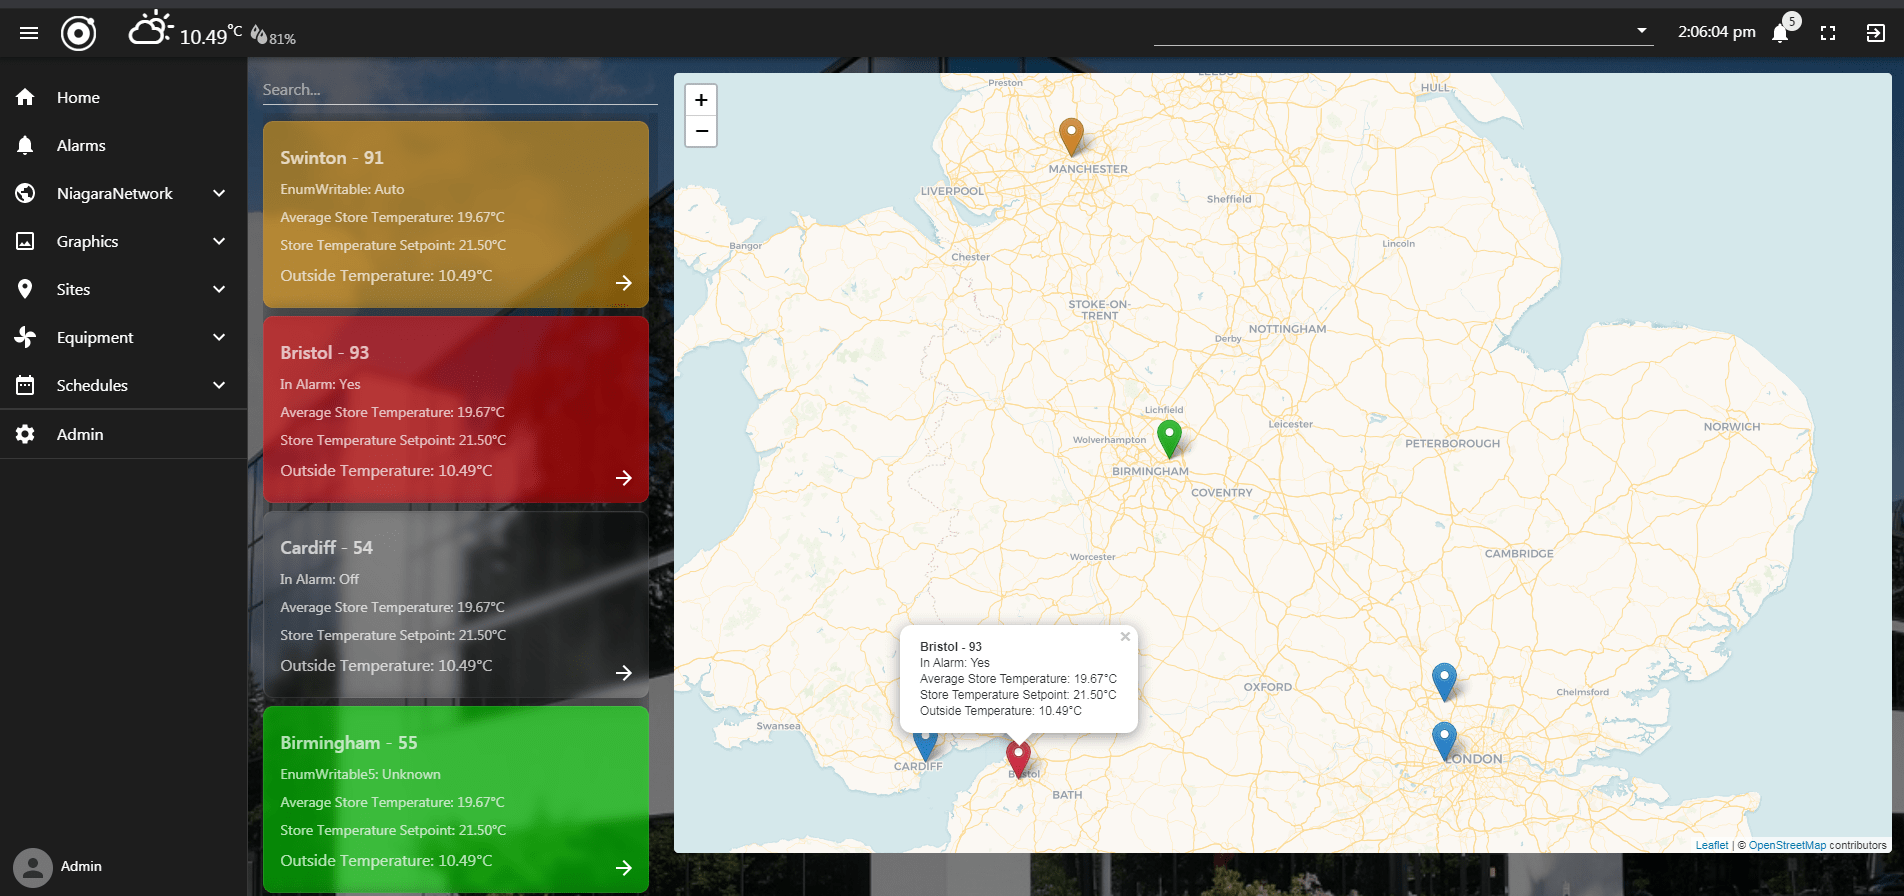
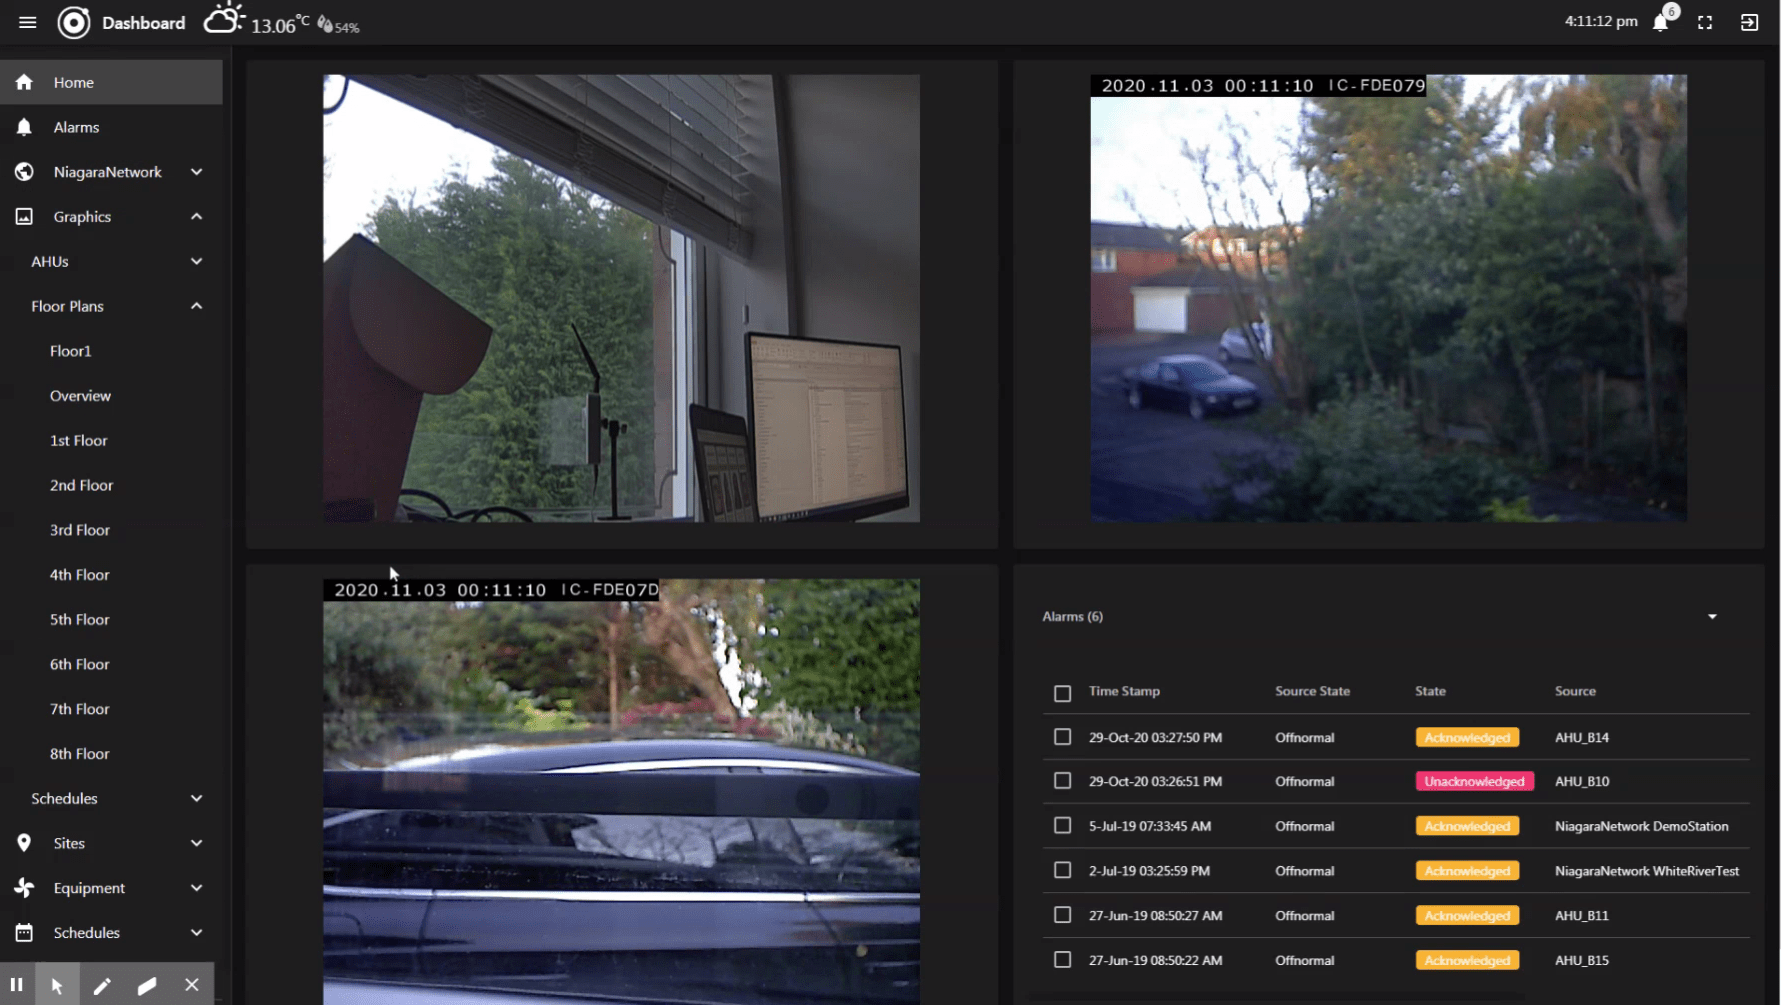
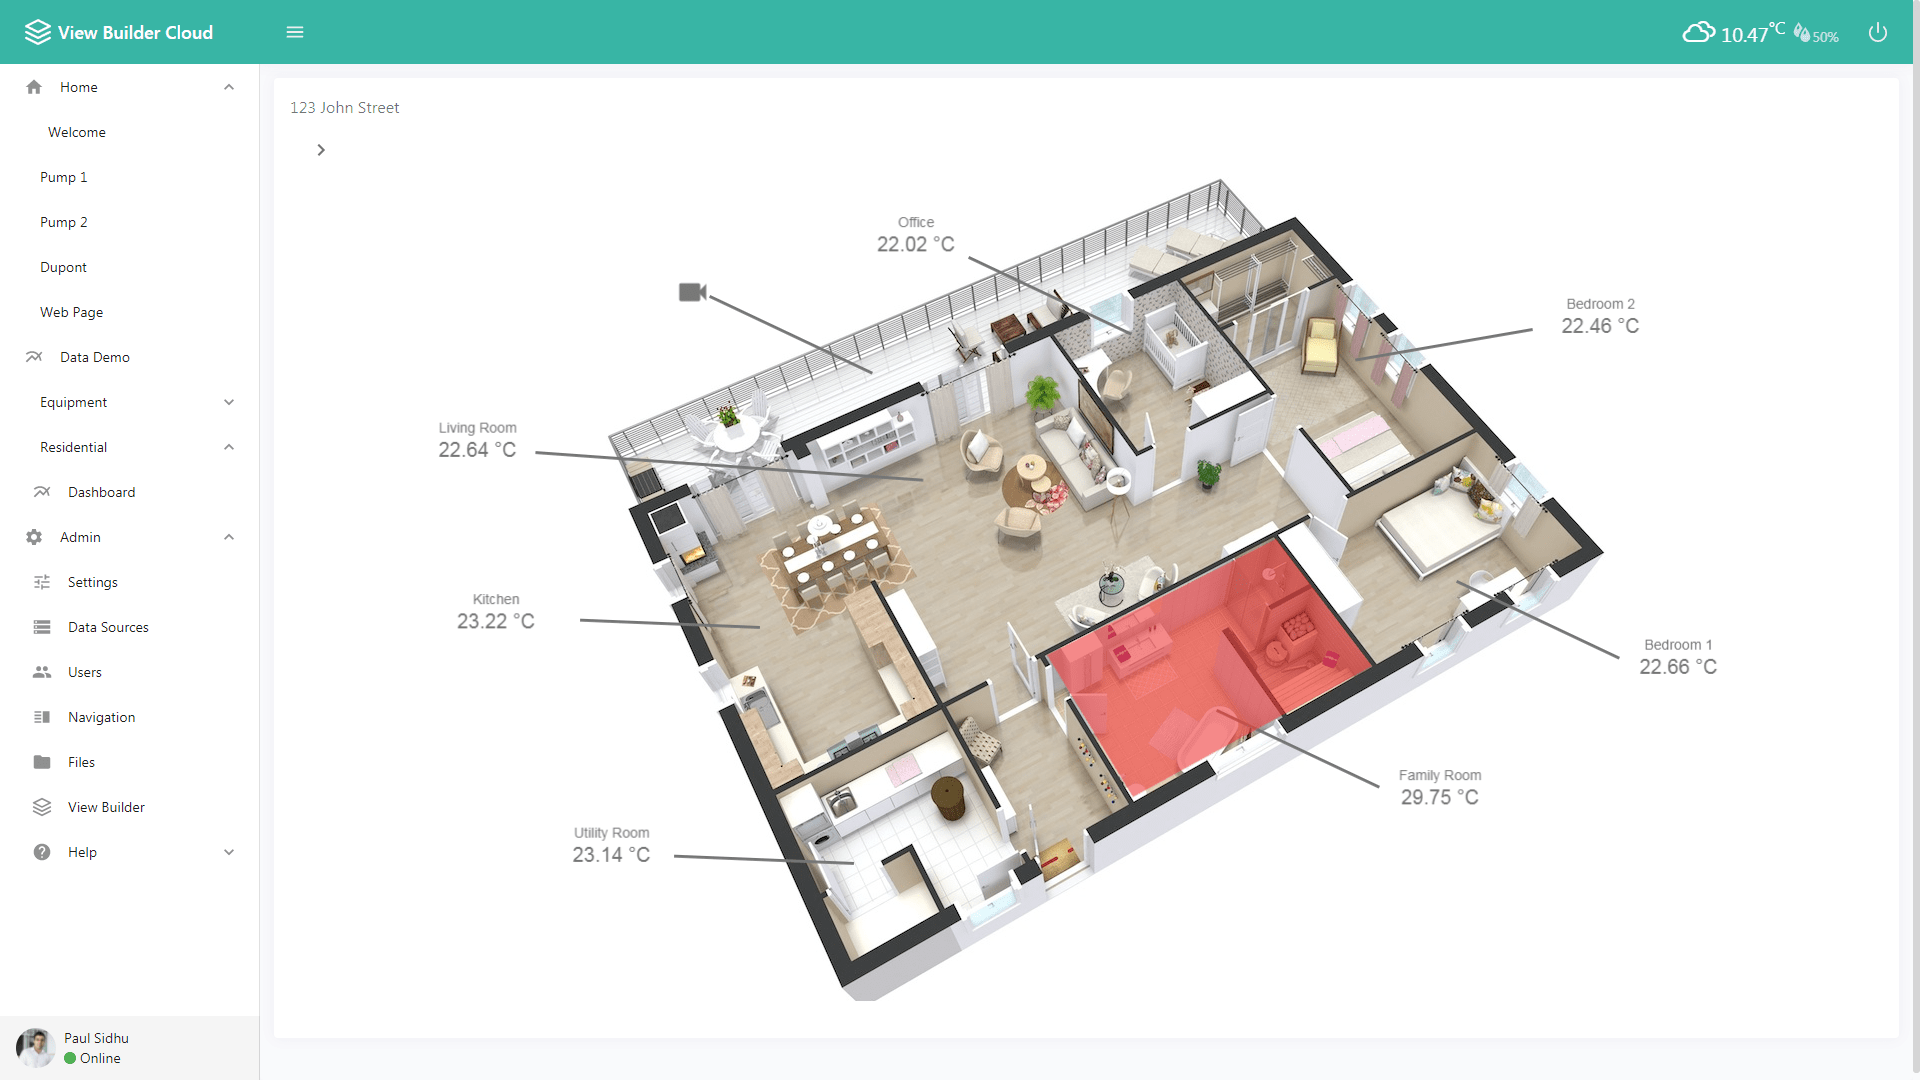
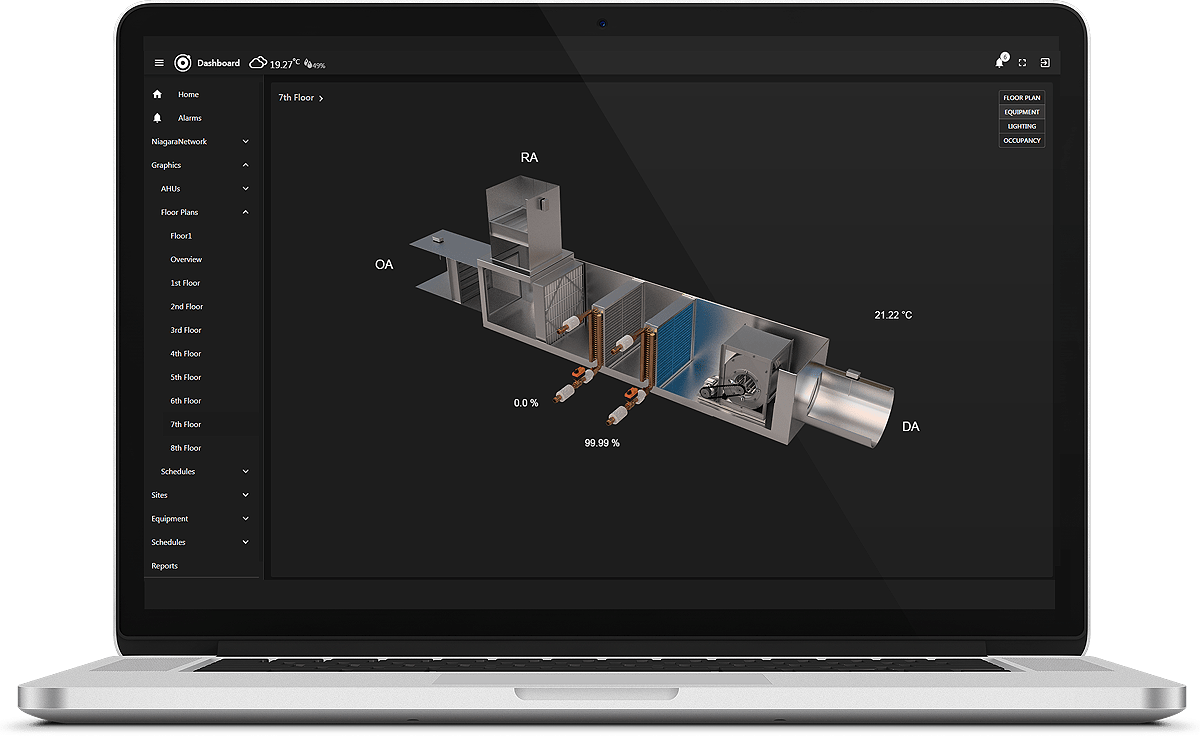
Floorplan Zoning/CCTV/Equipment View,
Hyperlink Widget,
Material UI Buttons,
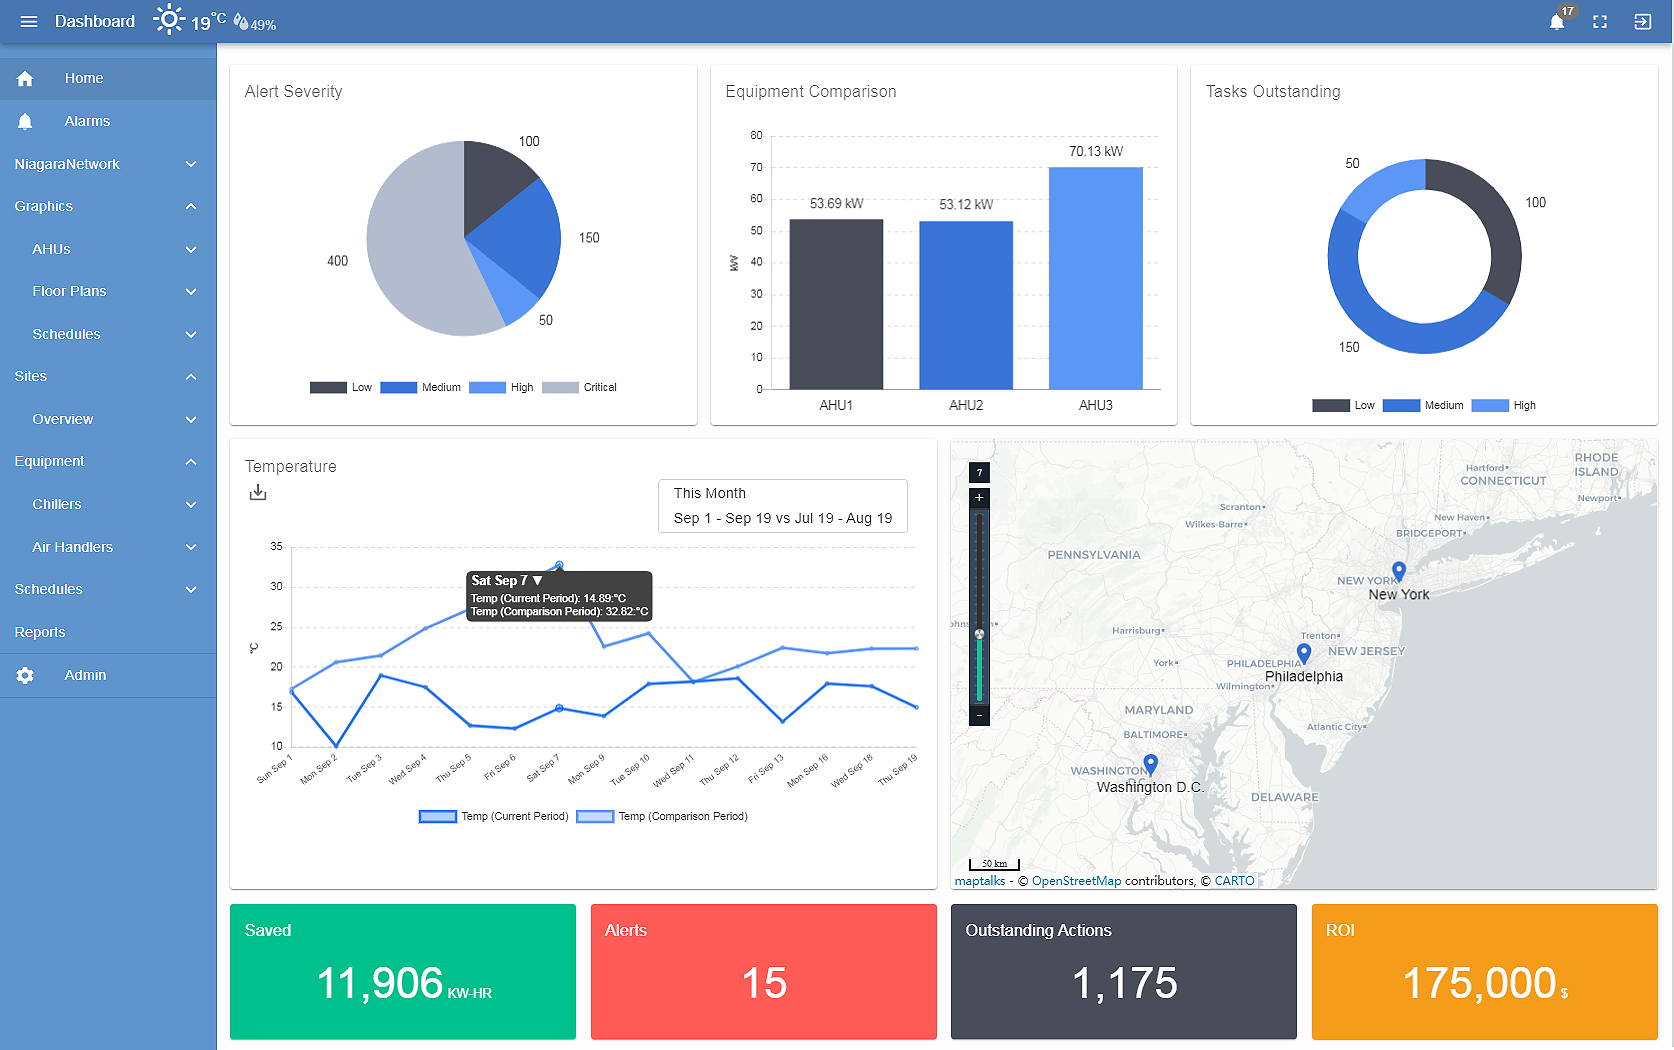
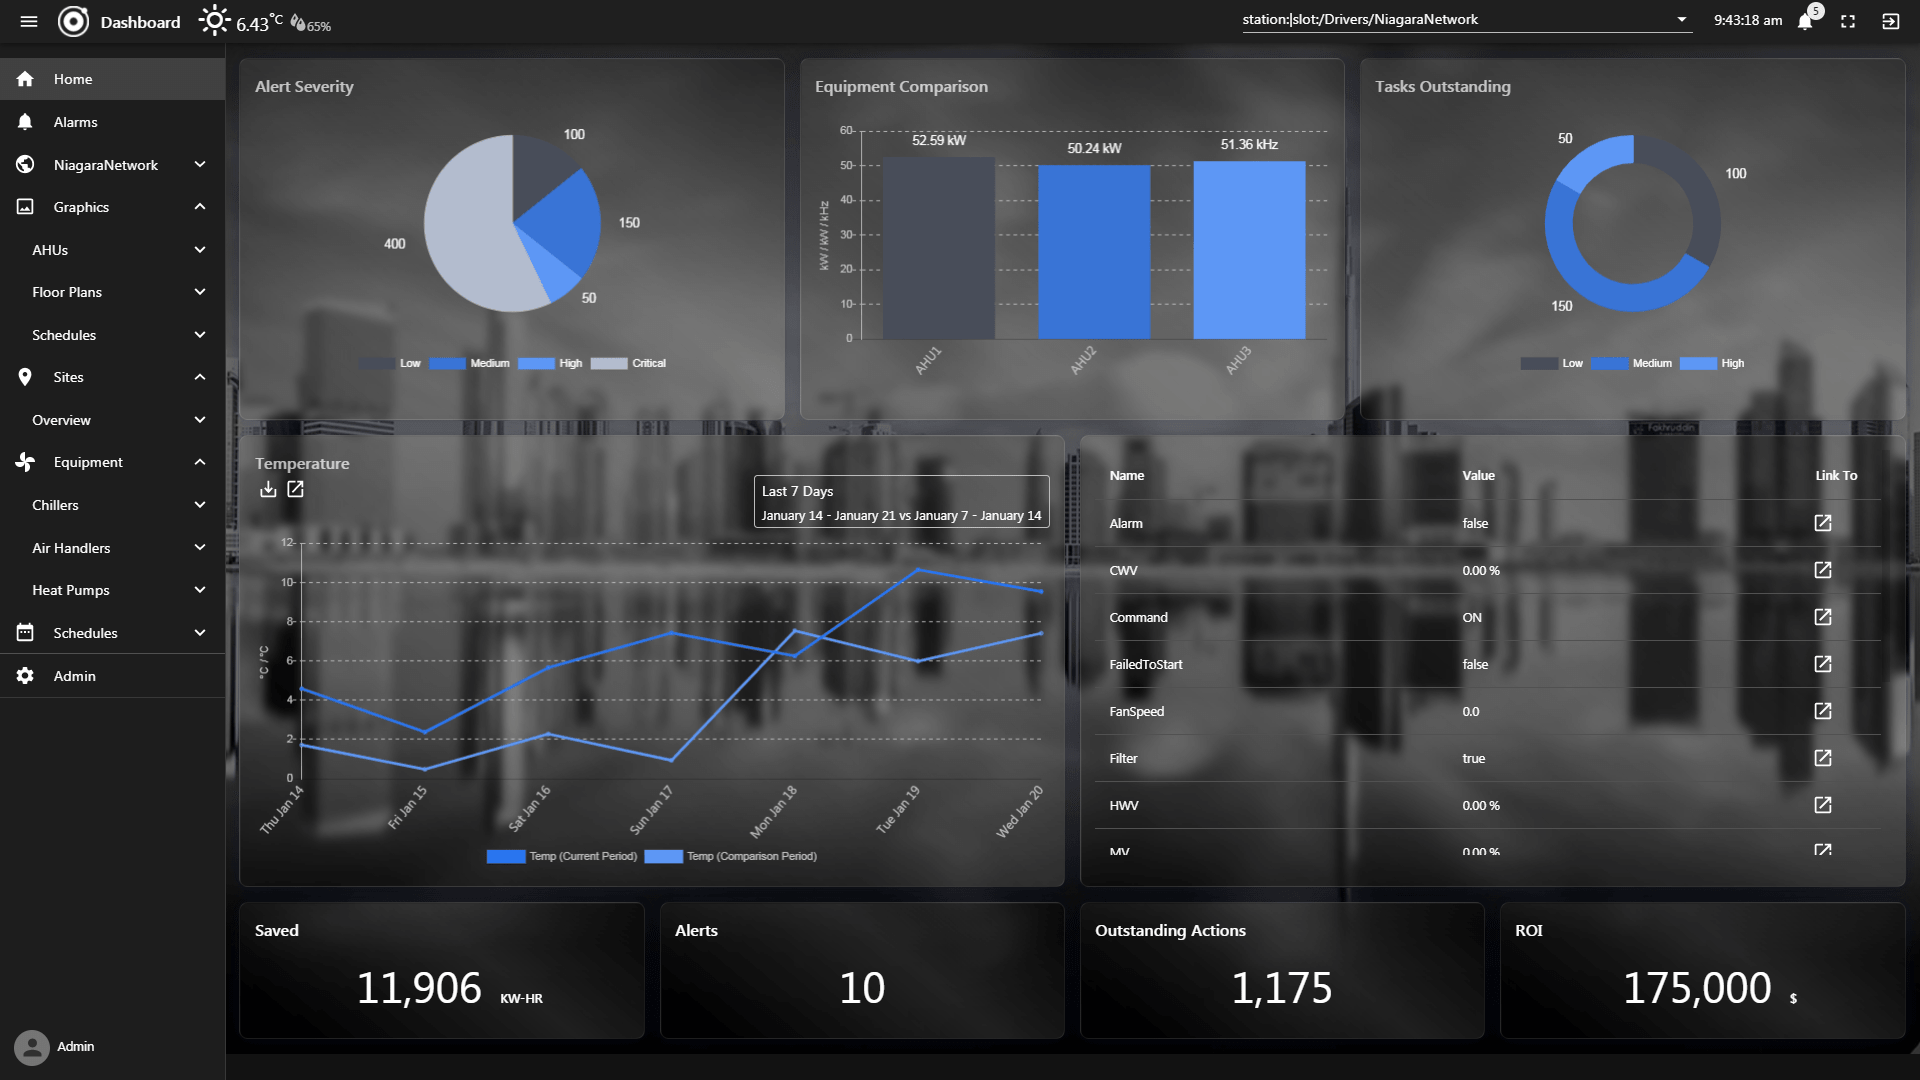
N4 Insights™©, N4 Analytics Charts,
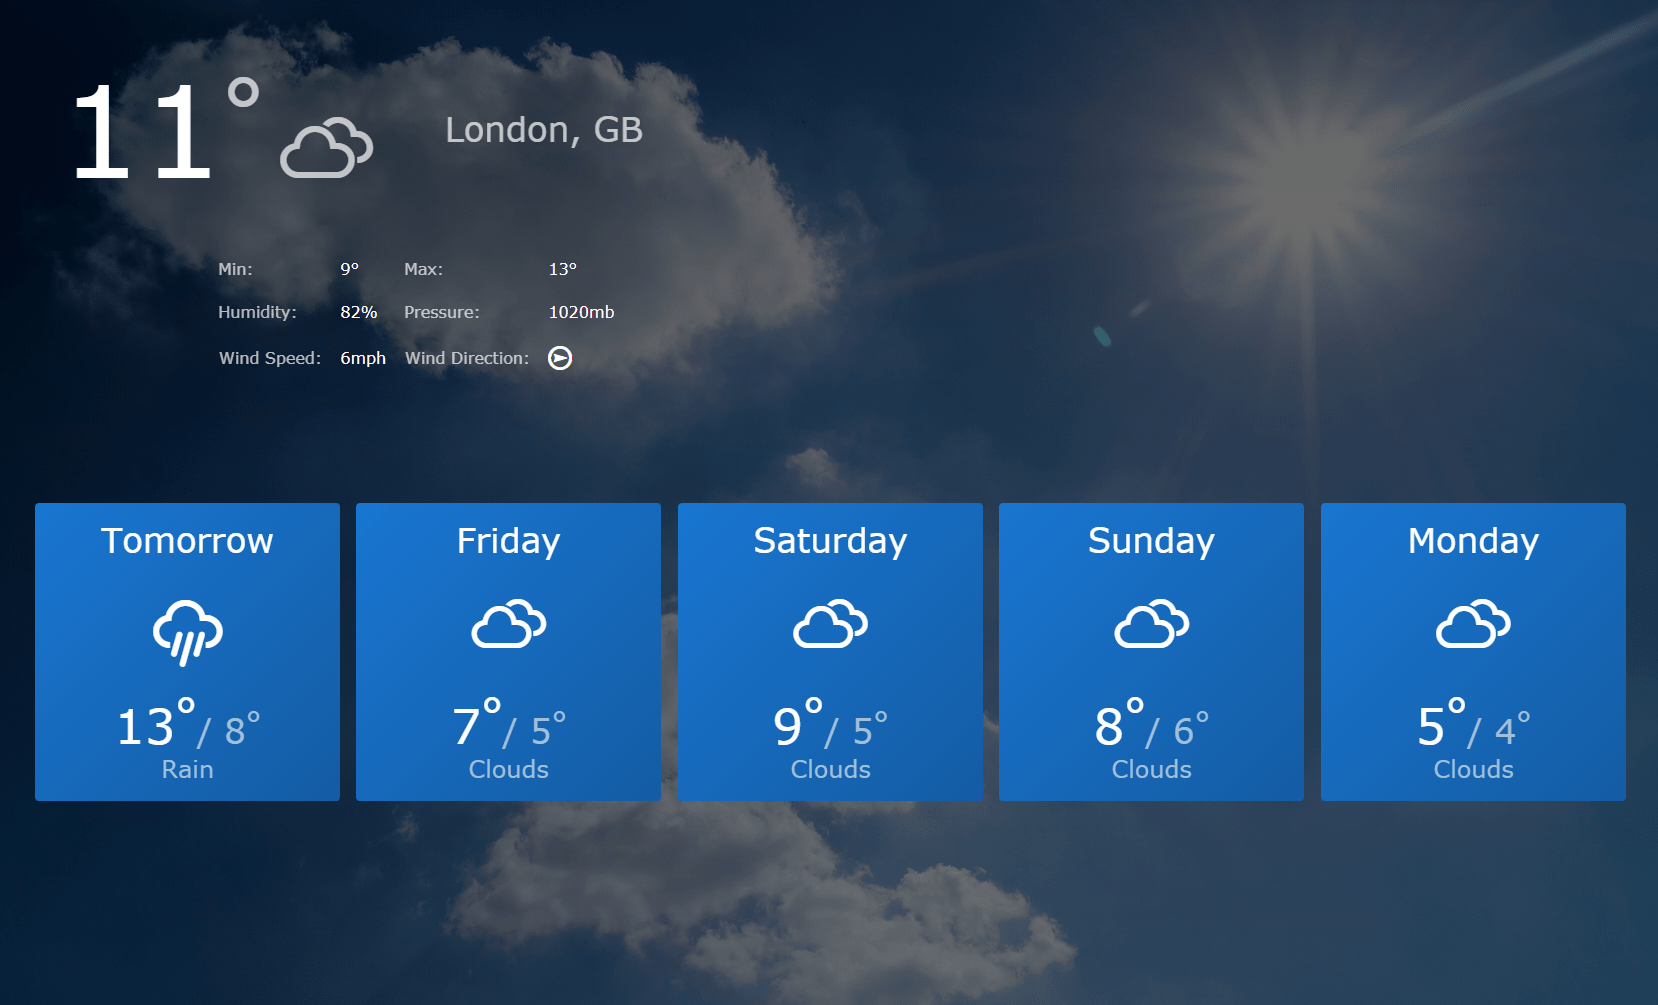
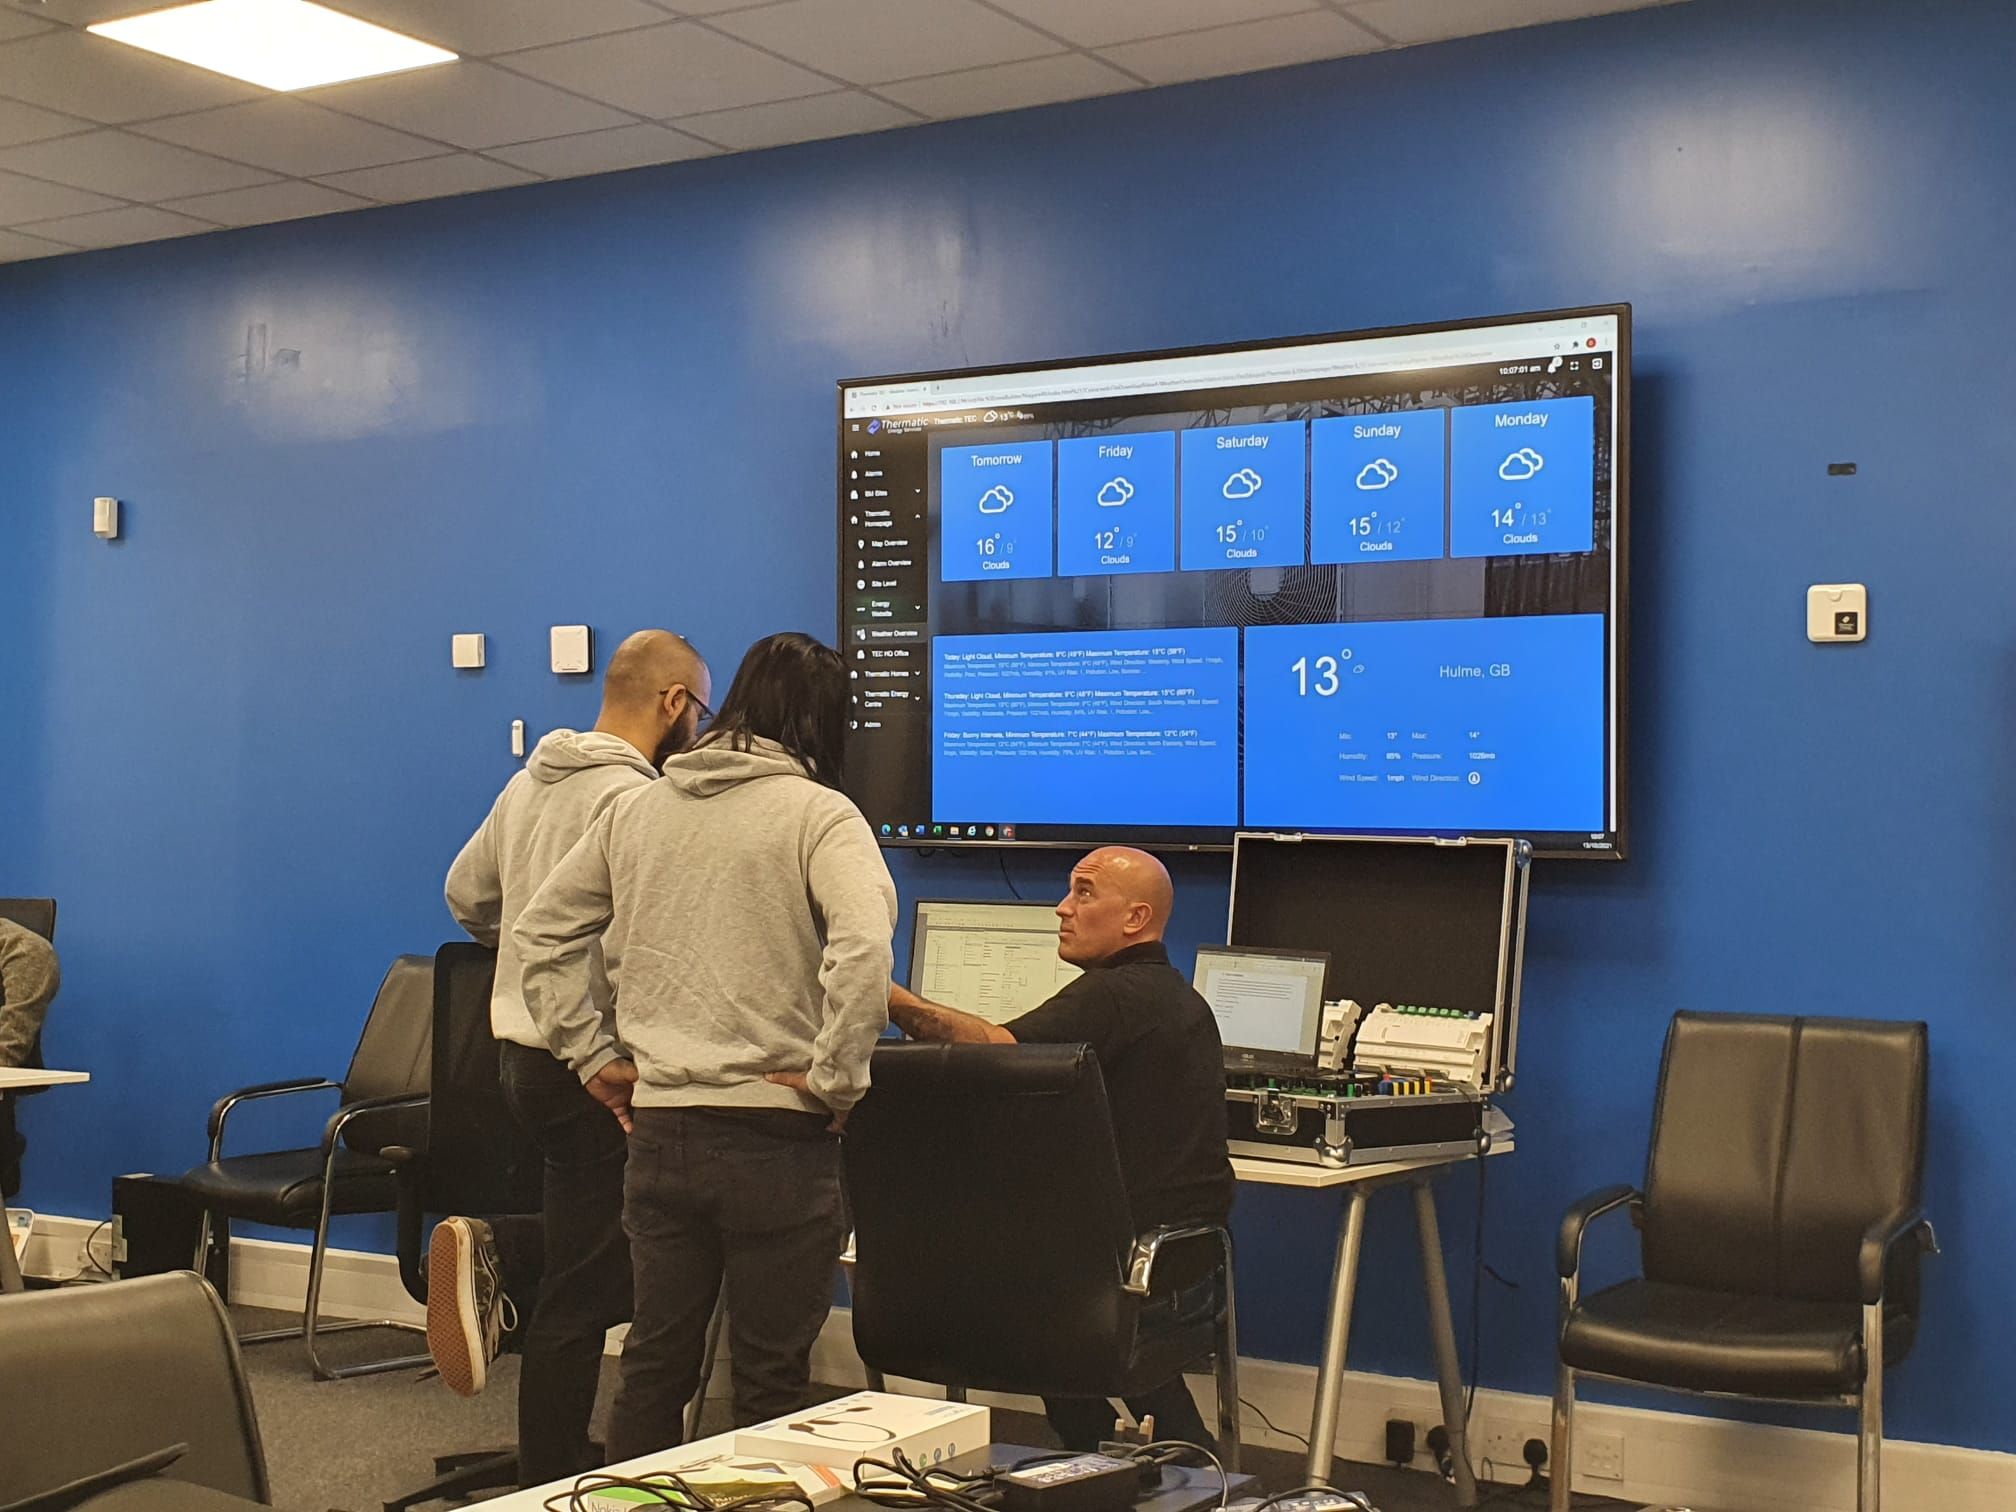
and a Free Weather Service which can be used on any project.
The dashboard supports multiple languages just by the click of a button. Be sure to check out some Examples...
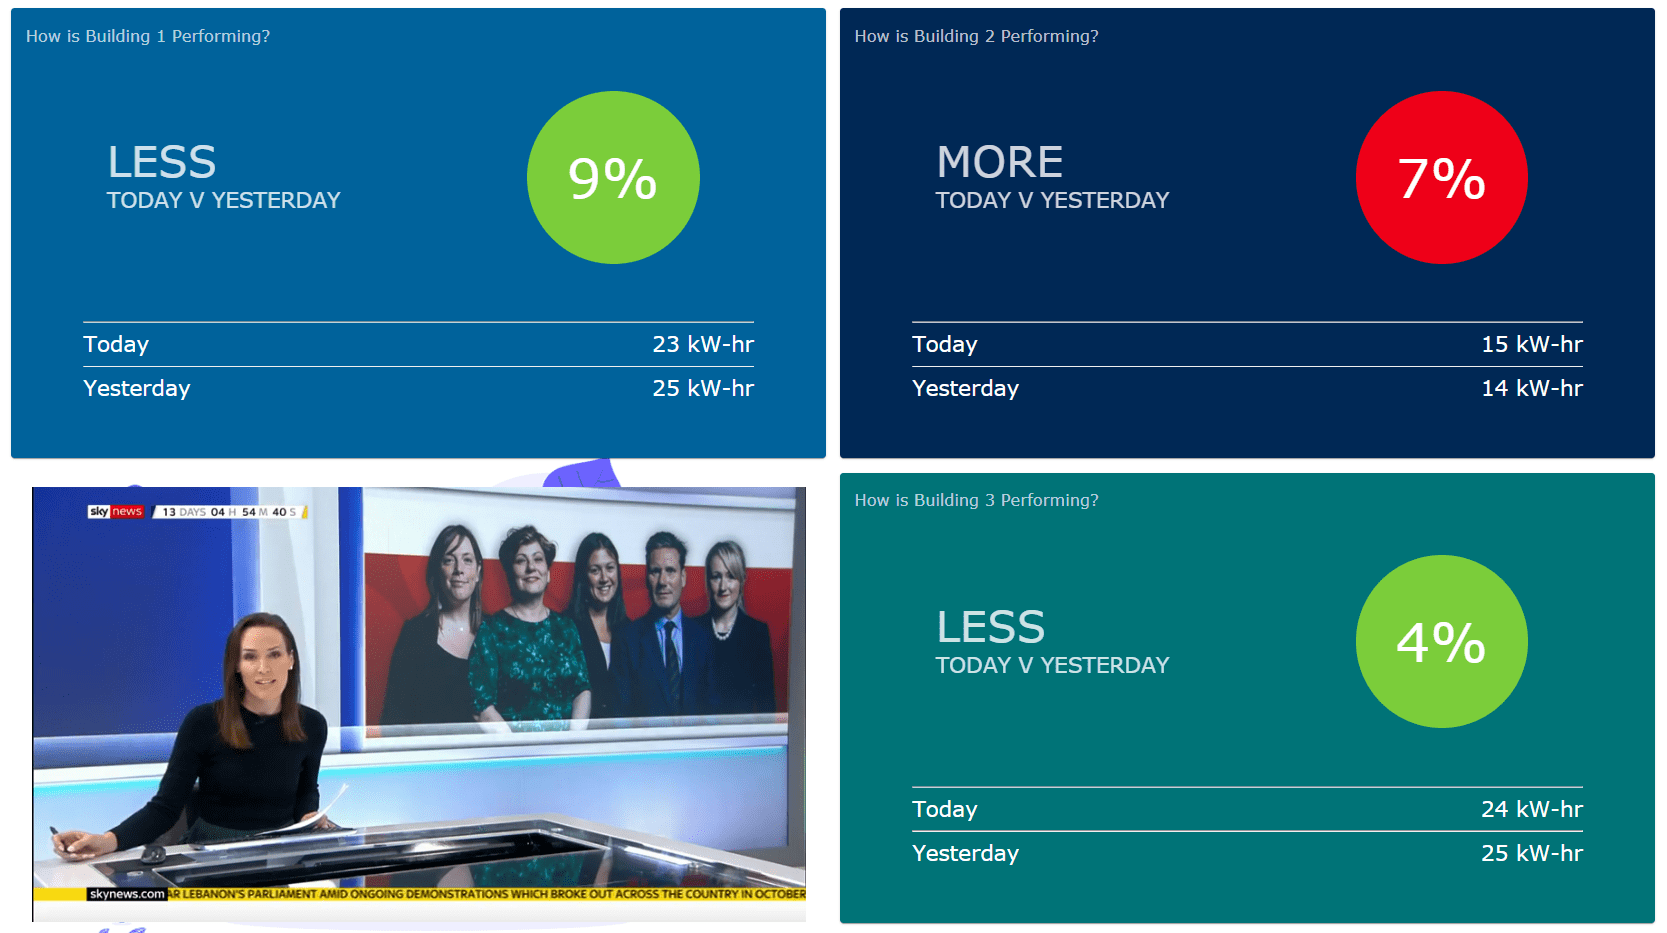
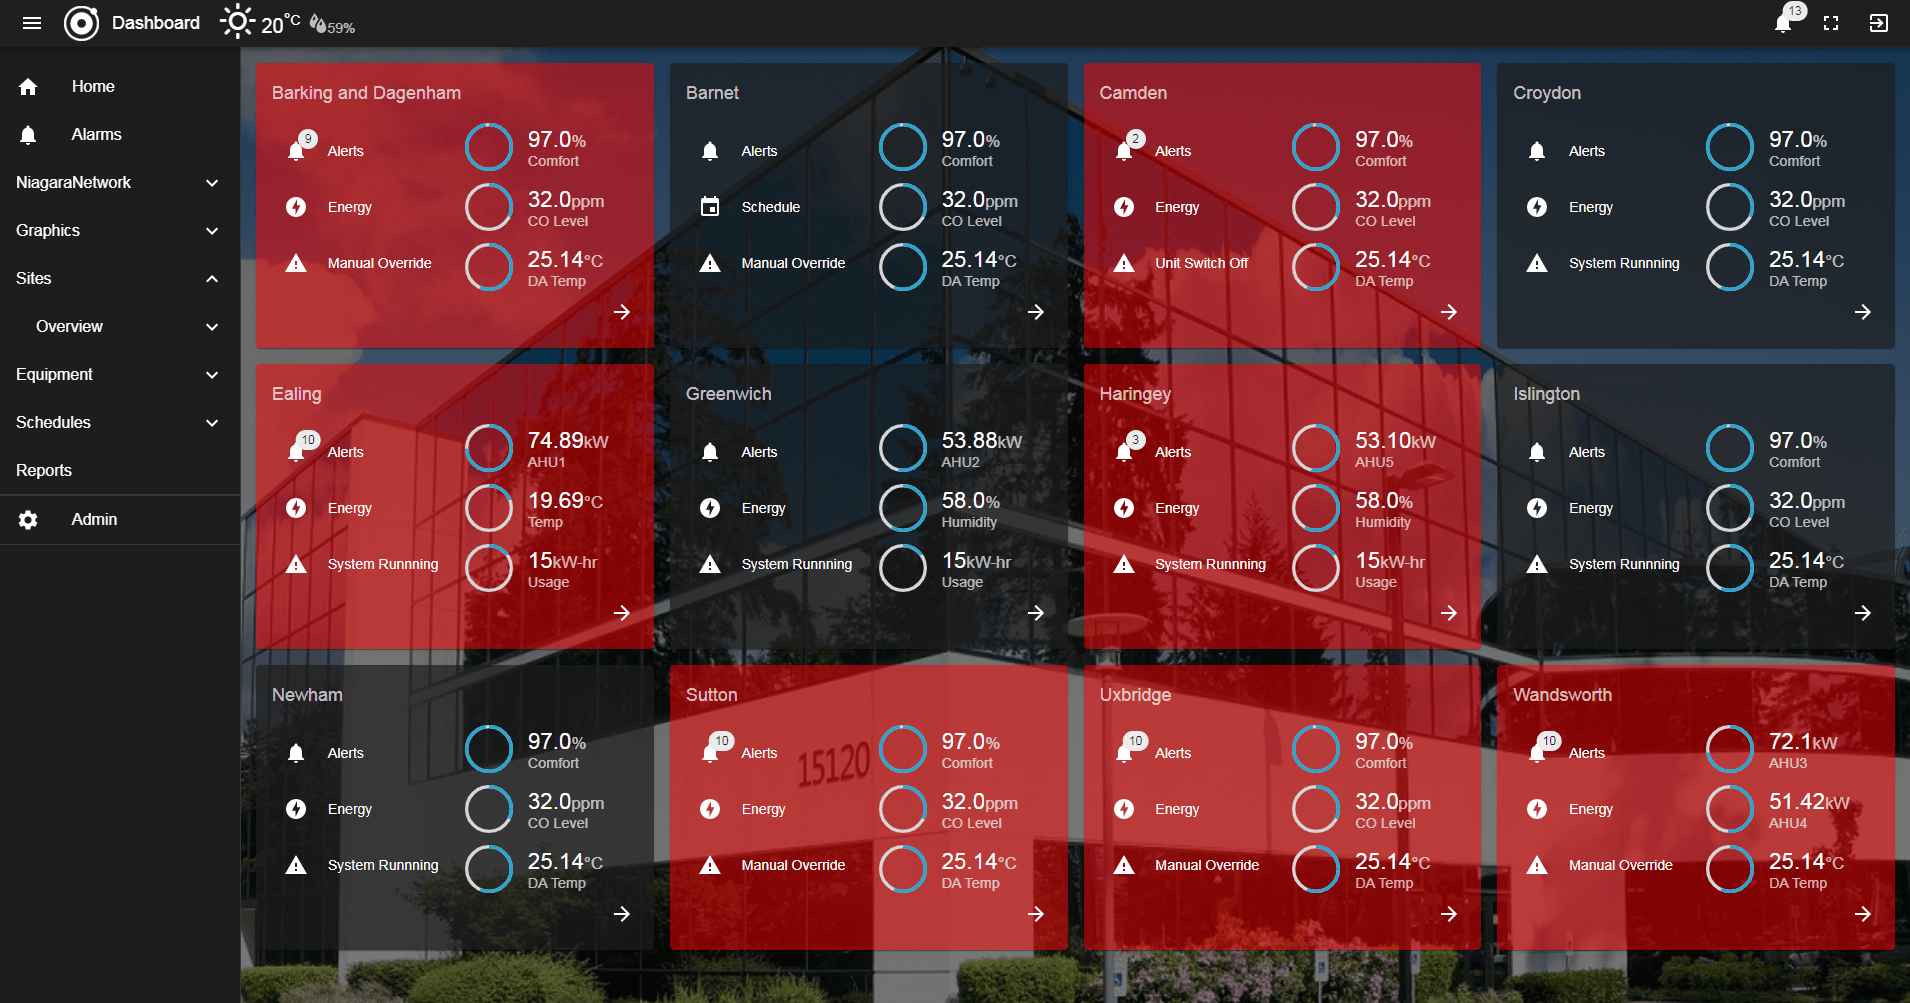
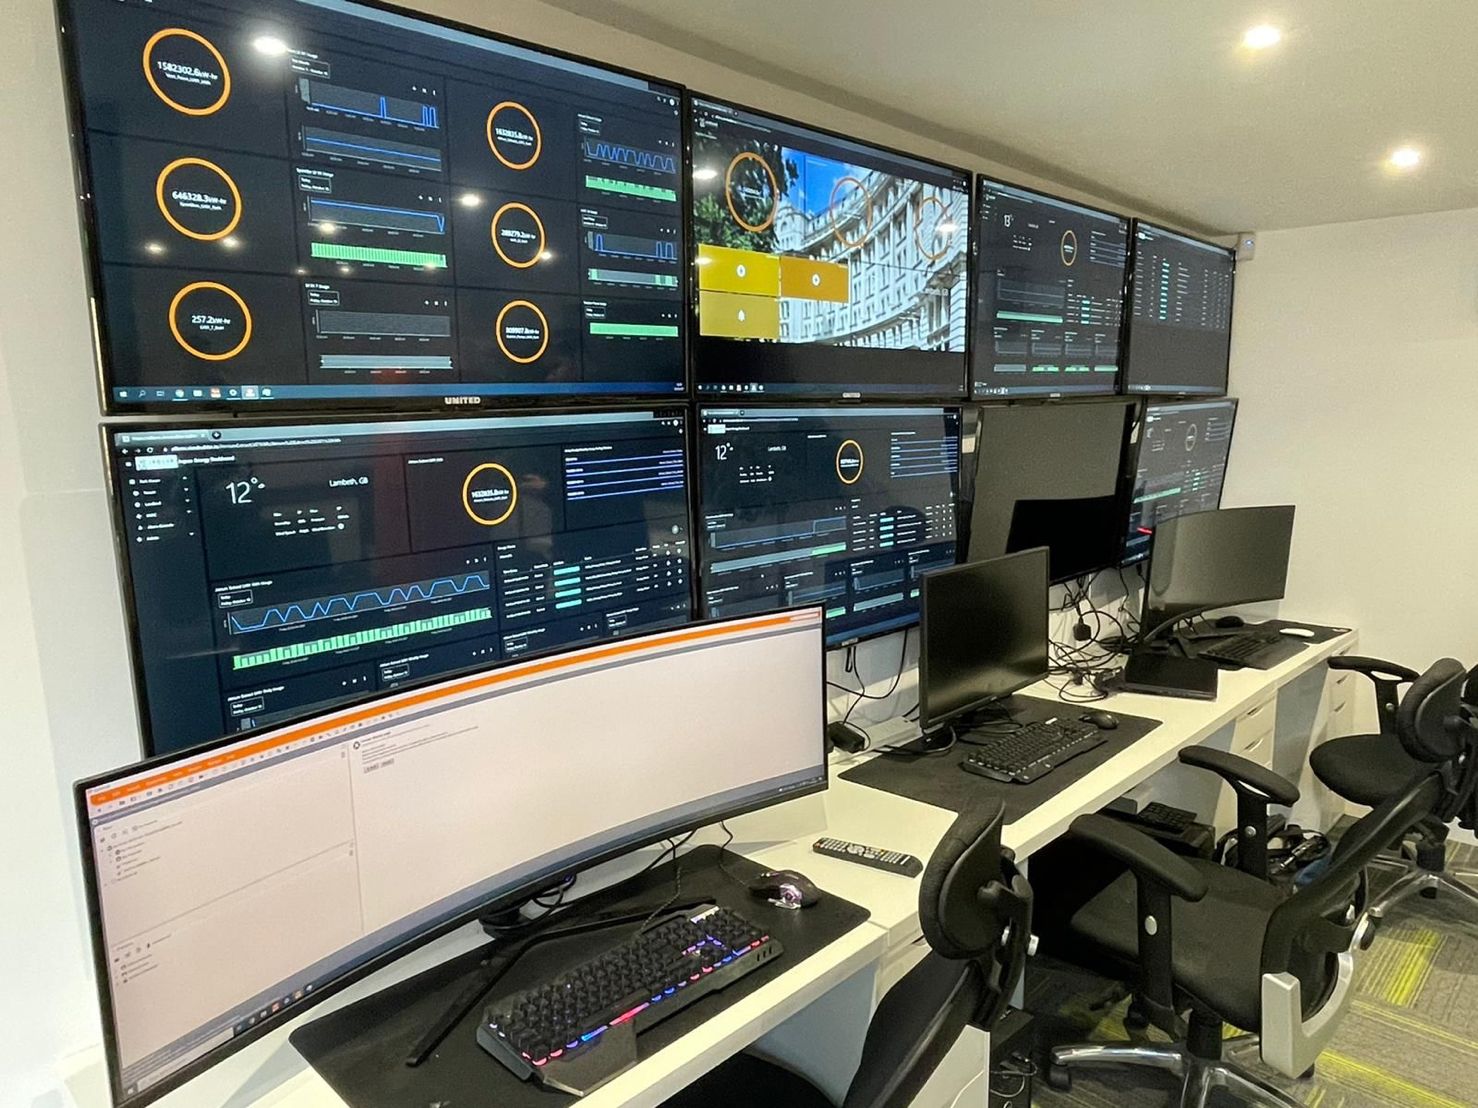
Additionally, turn your station into a digital signage display system. Show comfort levels, information, weather, announcements, analytics, videos, and loads more.
Create slides by dragging n' dropping widgets onto different screen layouts. The screen changes automatically at a configurable interval.
N4 Analytics - if you have created station analytics using algorithms and tagging, data can be plotted onto charts for analysis. Export data in CSV format to further analyze data.
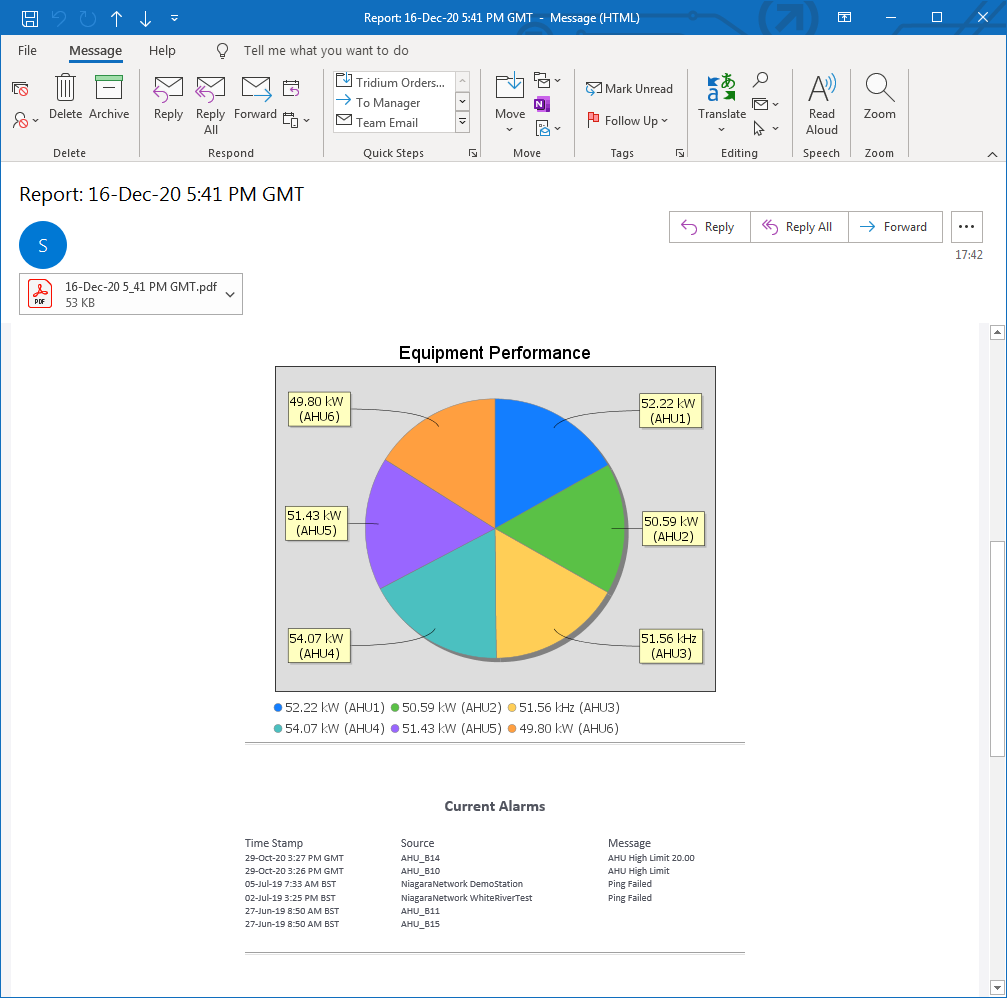
N4 Automated Reports - create daily, weekly, monthly automated reports. Drag n' drop histories, points, alarm tables, and other niagara objects onto email templates.
Or use it
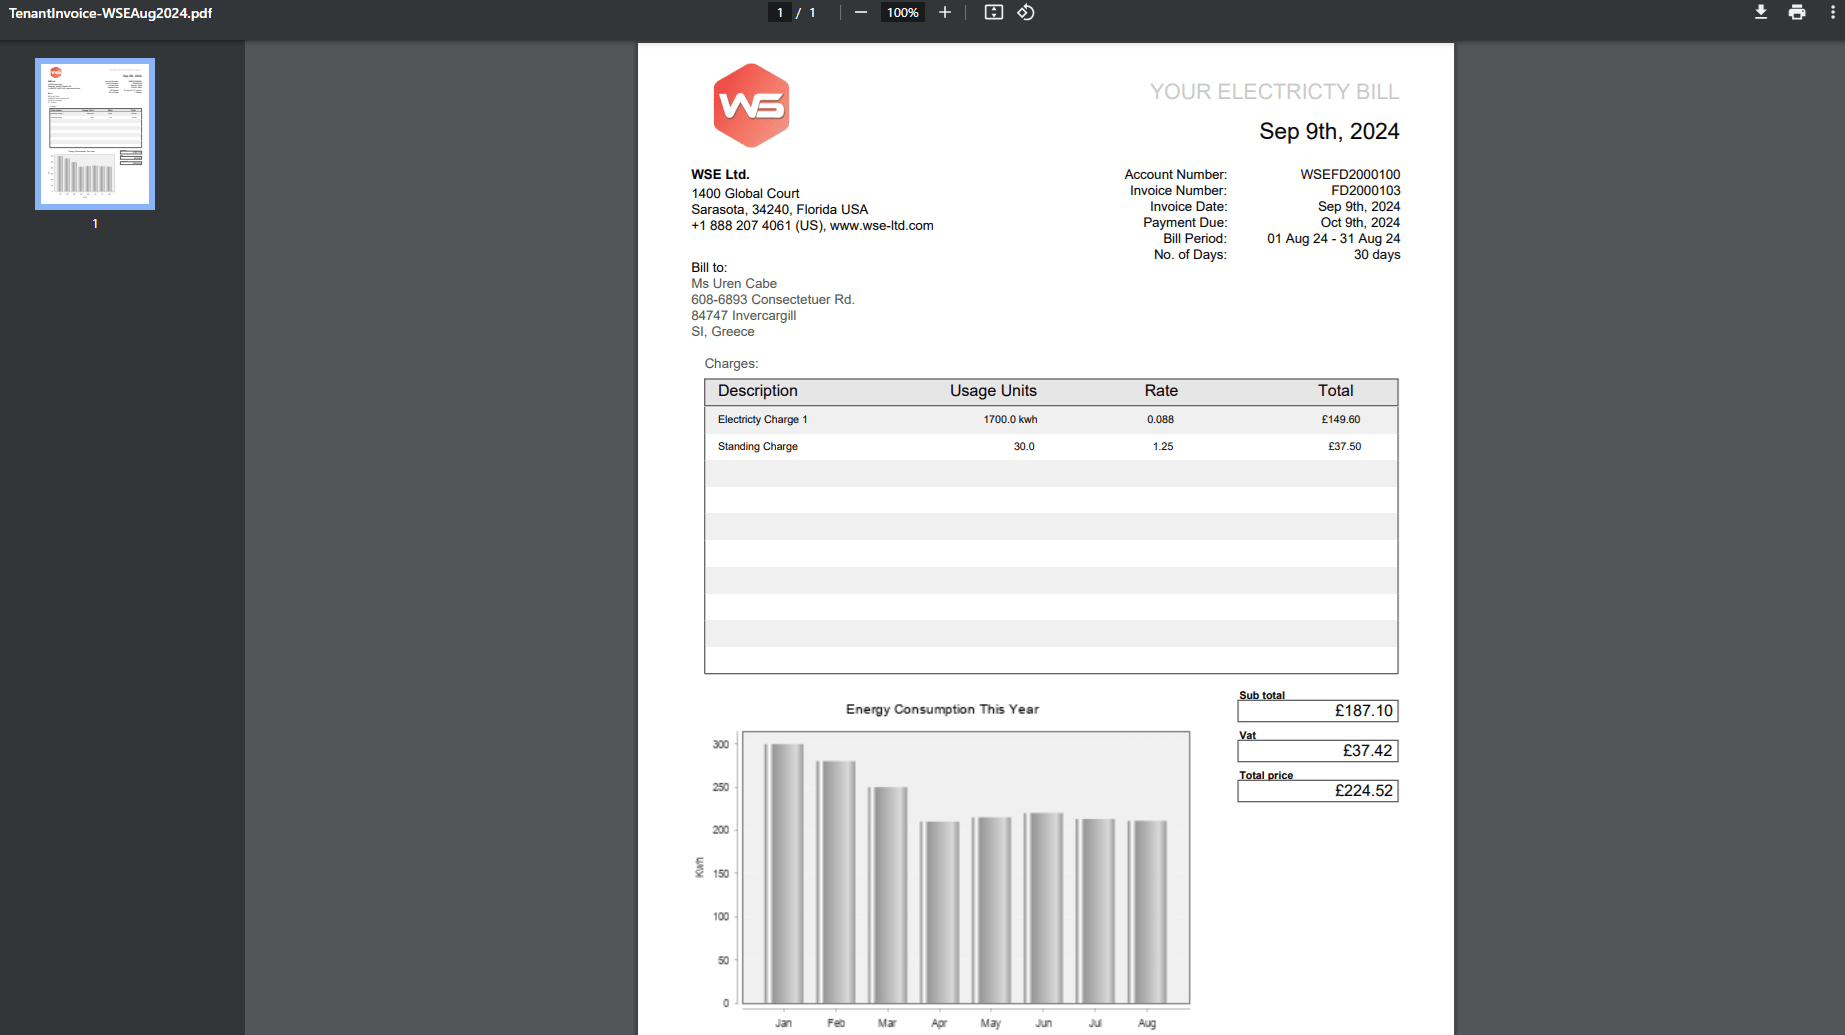
for tenant billing purposes. Use the Report Builder to build a custom trend history report.
Tenant Billing - Aggregate meter histories using BQL, rollups, or logic on the wiresheet and schedule it to got out at the different periods.
The template can be modified using N4 View Builder™©. Change the look n' feel, logo, line items, tax rate, addresses. energy, water, or gas rates etc. It doesn't use any external api's, its all done in native Niagara. A PDF is sent to the tenant via the stations email service.
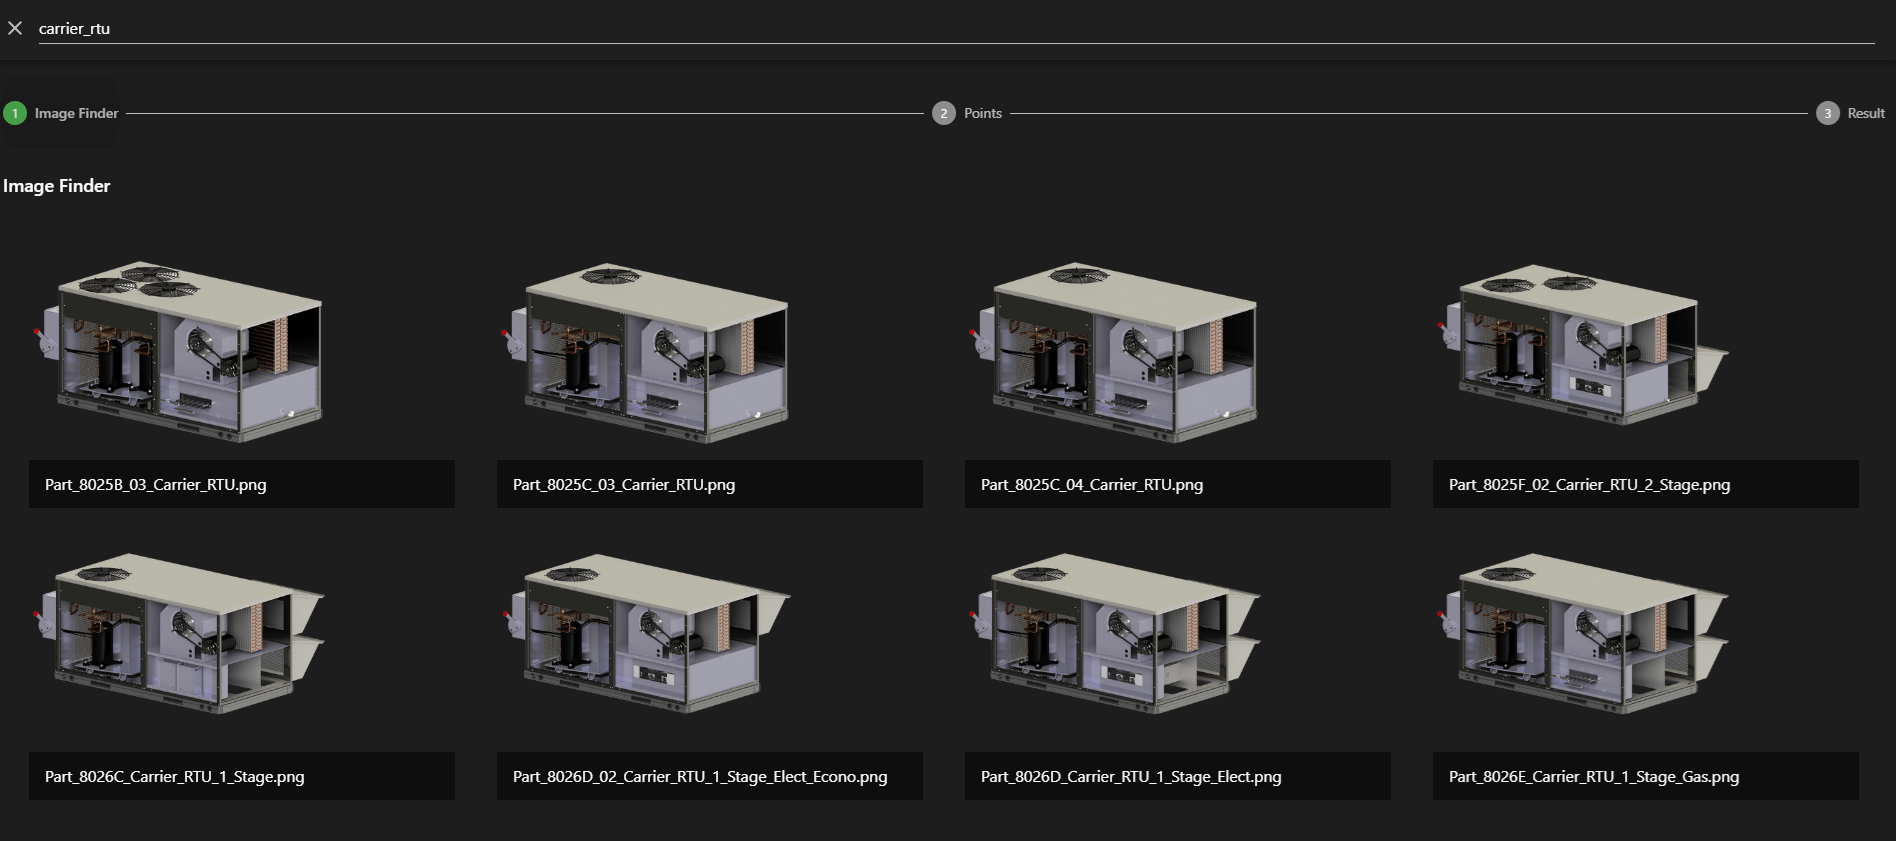
HVAC Image Finder - We offer you the base image, and customers have the option to purchase a complete set of animated graphics, cutaways, GIFs, and other enhancements for the selected equipment.
Contact us for more details.
SQL Import - if you have exported data out to Microsoft SQL or MySql database servers, you can easily bring this back into View Builder via the charting widgets.
Are you looking for a cost effective way to manage and visualize data for all your customers? Why not have a look at View Builder?
Version 5 Features (Available Now)
Here are some of the features in Verson 5:
- Alarm Notification Pop Ups
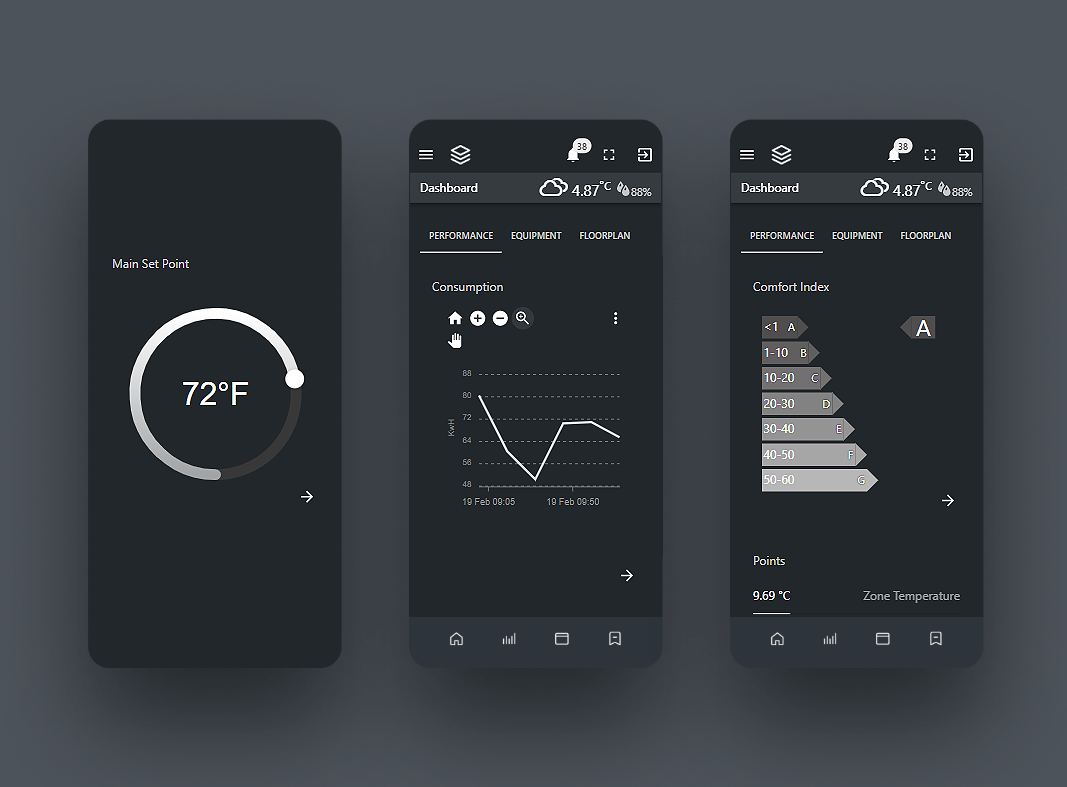
- Alarms to Mobile App
- New UI Styling
- Resizing Grids Dynamically
- VB Designer - Real time preview
- User Settings - each user can have different style of dashboard
- Dynamic Widgets - when time drop down is changed, all widgets on screen change
- Pre-set Graphic Templates.
- Map Box 3d Building
- On Screen Edit - add/swap similar widgets
- Point Value - Show sparkline history
- Drag Points to grid, select widget, setup and configure
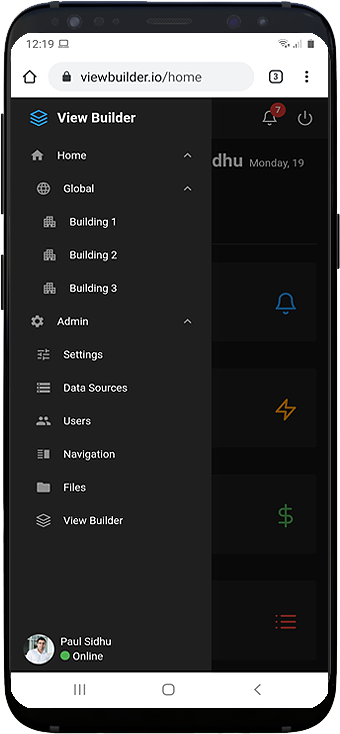
- Hierarchy menu navigation and building.
- Tag based widgets
- Auto Menu Building
- Icon Menu
- Time Series charts - auto refresh
- Bound Table: neql queries
- Tenant Billing
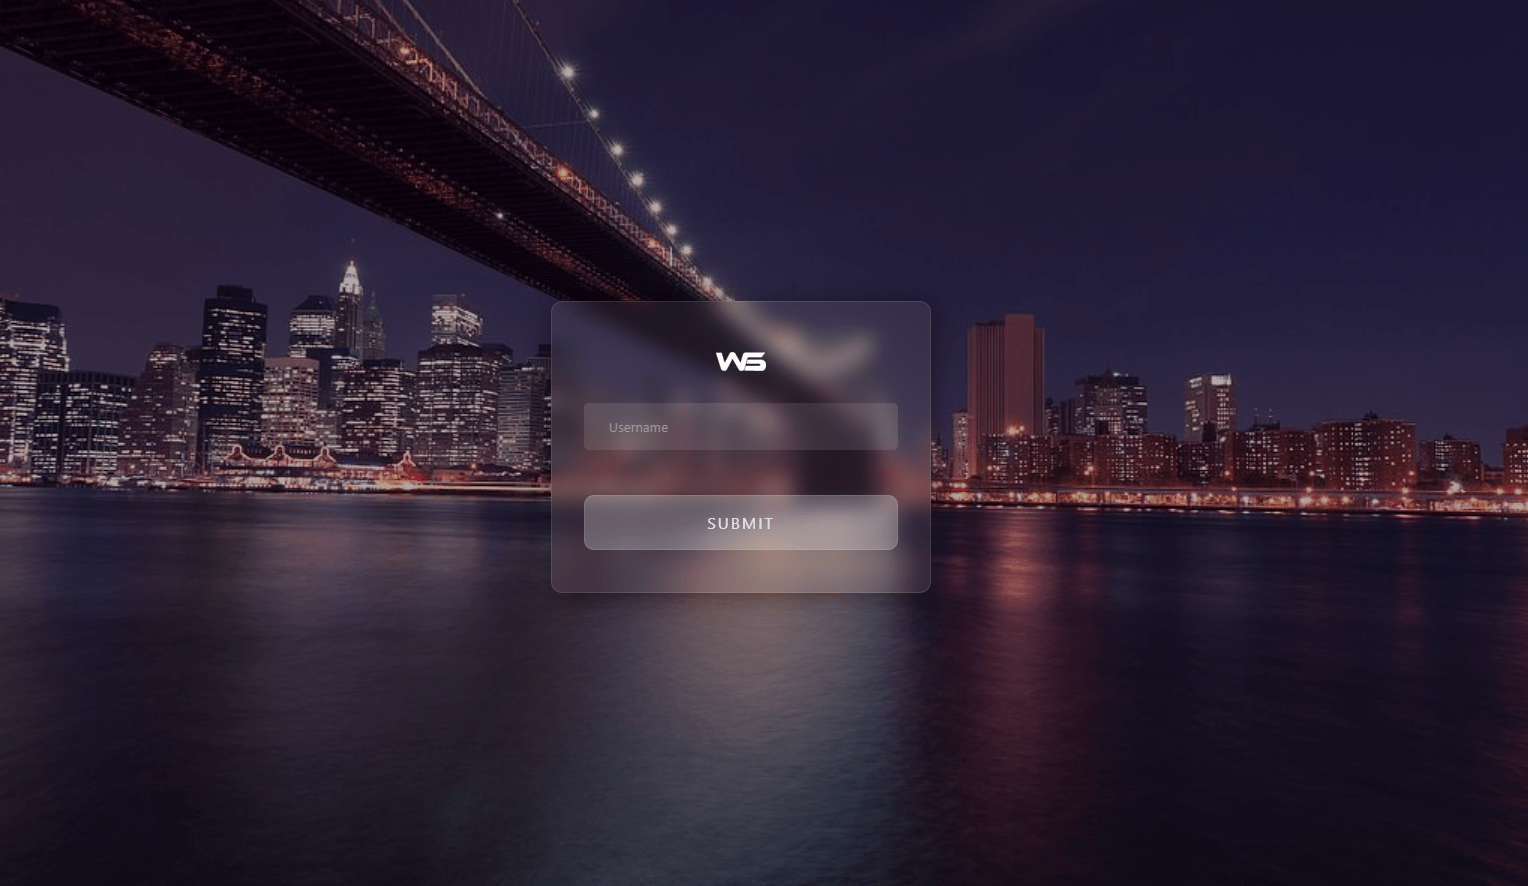
- Auto Login
- HVAC Image Finder
Upcoming Developments
Here are some of the features we're putting in the next release:
- Energy Optimization
- 3D Graphics
- Actionable insights
- Site efficiencies dynamics
- Live Data anomalies
- Recommendable insights without AI
- Explore Historical Performance with a Unique Time-Lapse Feature
- Empower Engineers to Refine & Master Building Energy Efficiency
- Create "What-If" Scenarios and rules logic
- Forward Models & Predictive Maintenance
- A Master Optimization Table
Got any feature requests? Drop us a message here