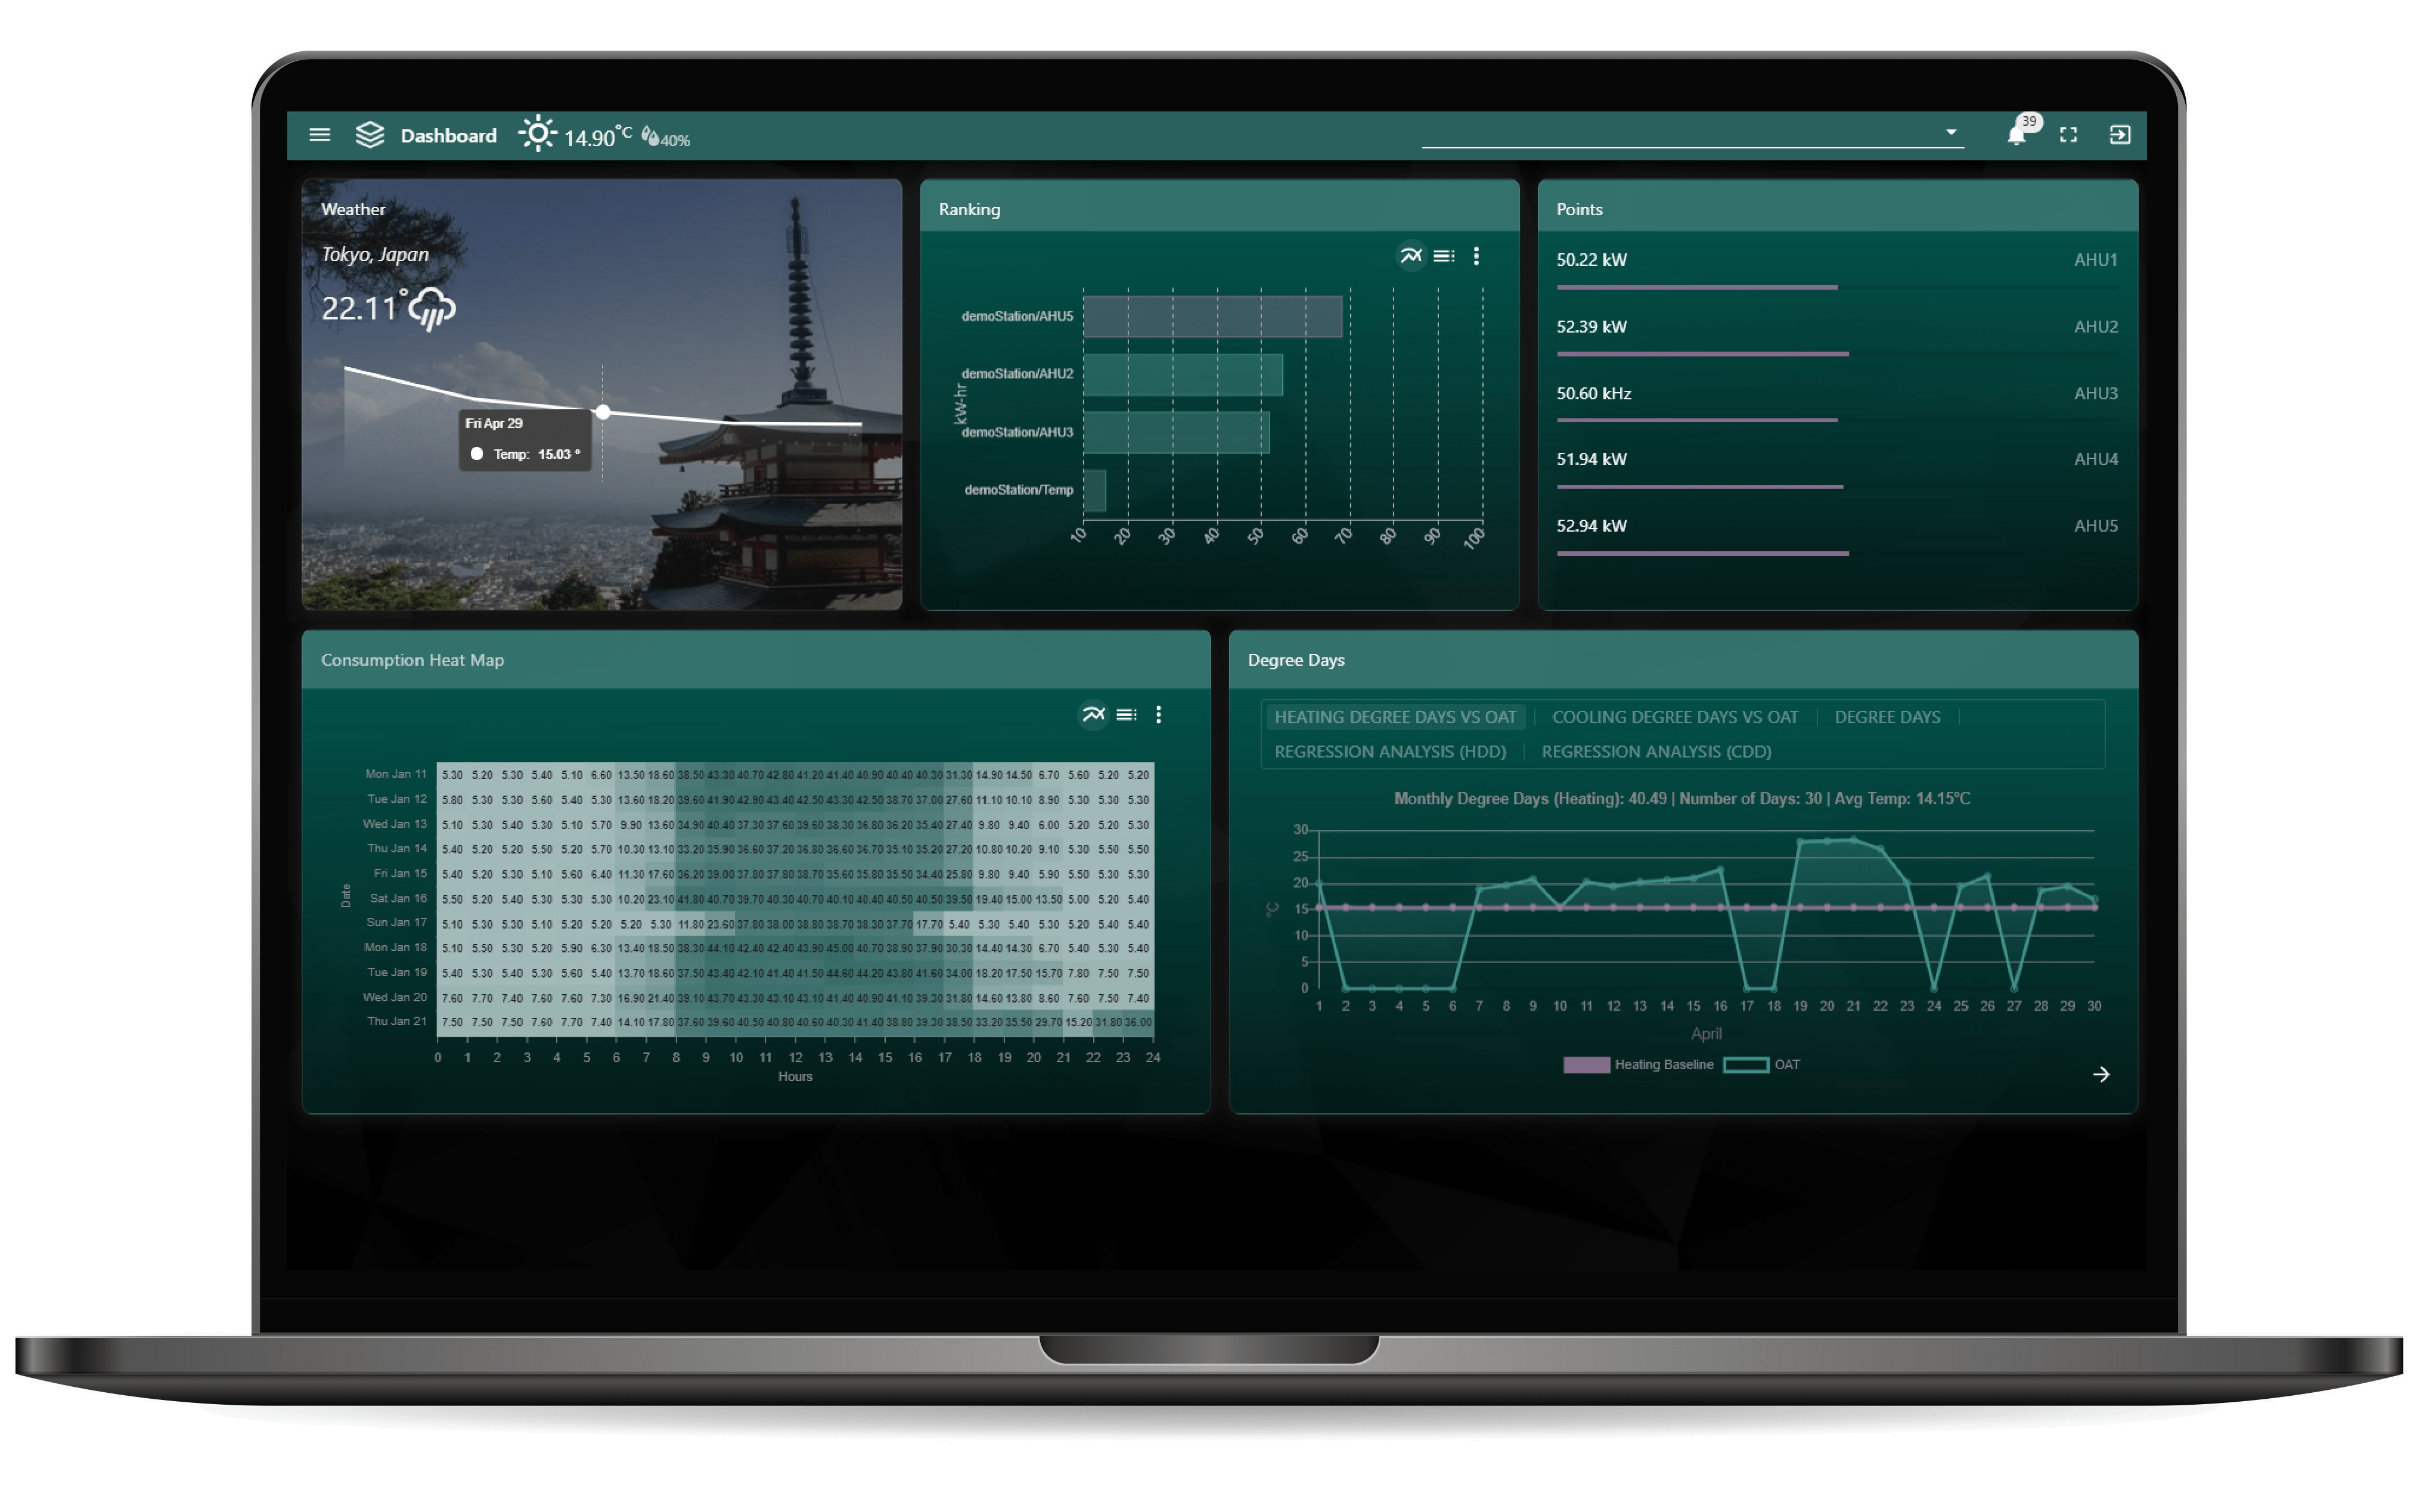
N4 Heat Map Chart


  • Show Heat Map Intensity
  • Updates in Real-Time
  • Uses BQL Query to Collate History Data
  • Modify to Your Style
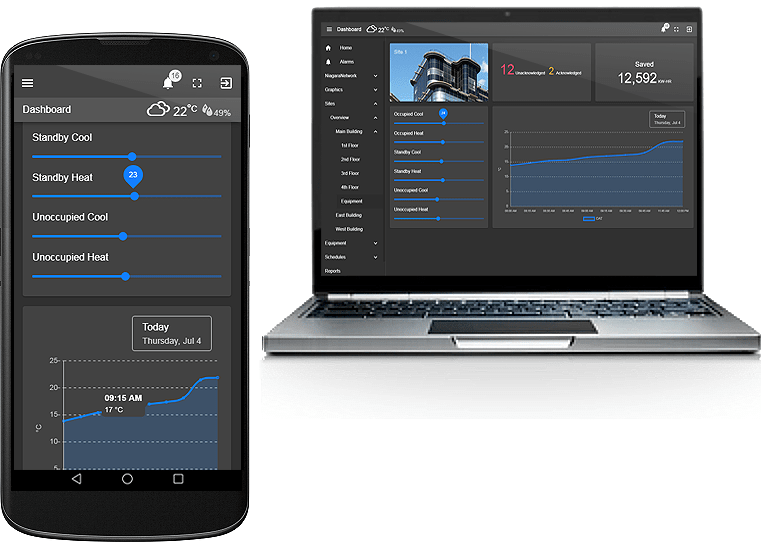
  • Works in Workbench and Modern Browser
Add to Cart
n4 charting

Overview


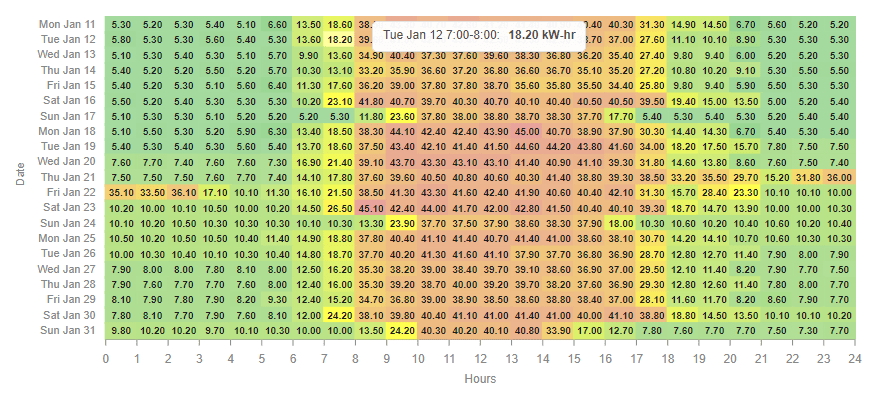
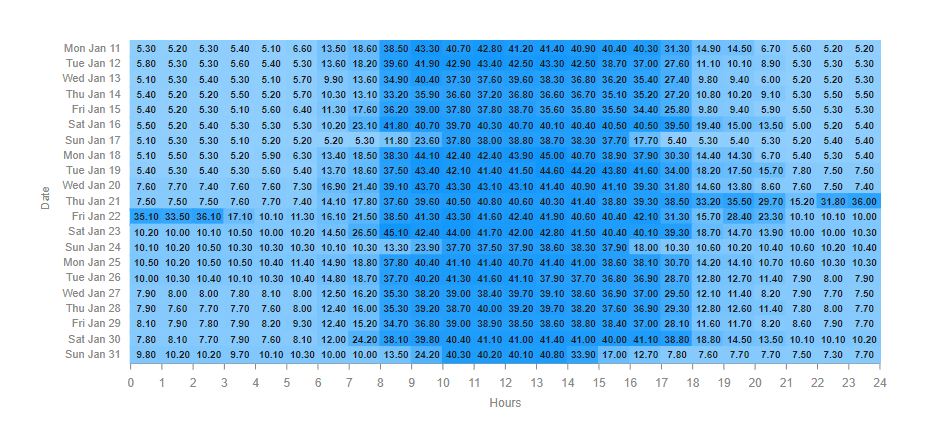
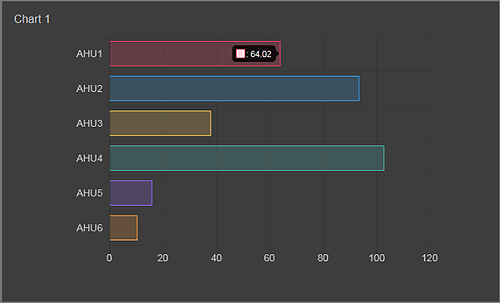
The heat map chart shows the intensity of an object. The color automatically changes based on the trend value. It can be a single color and changes its intensity accordingly. Or you can set it to multi-colour which goes from green to red or flip it to red to green. The date is on the y-axis and hours are on the x-axis. Hover over the cell to get more info for that time range. Also check out the Energy View Template.

Are you looking for a cost effective way to manage and visualize data for all your customers? Why not have a look at View Builder?

Usage


Before you start. Download the modules from our portal (see your order confirmation, which also explains licensing). Copy the modules file to your modules directory. Restart BOTH station and Workbench.

1. Copy the heatMapchart-ux file to your modules directory.
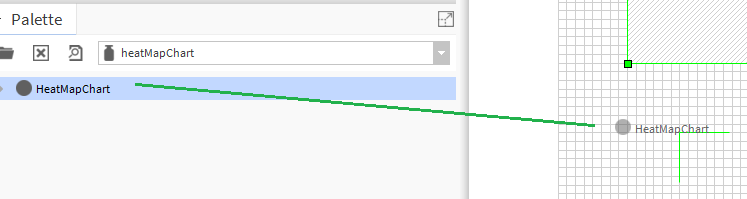
2. Open the module from your palette file.
3. Drag and drop the widget from the palette onto your px view.

Tridium heatmap


Properties


The widget has a number of configurable properties that can be used to modify look, feel, and functionality.

building optimization


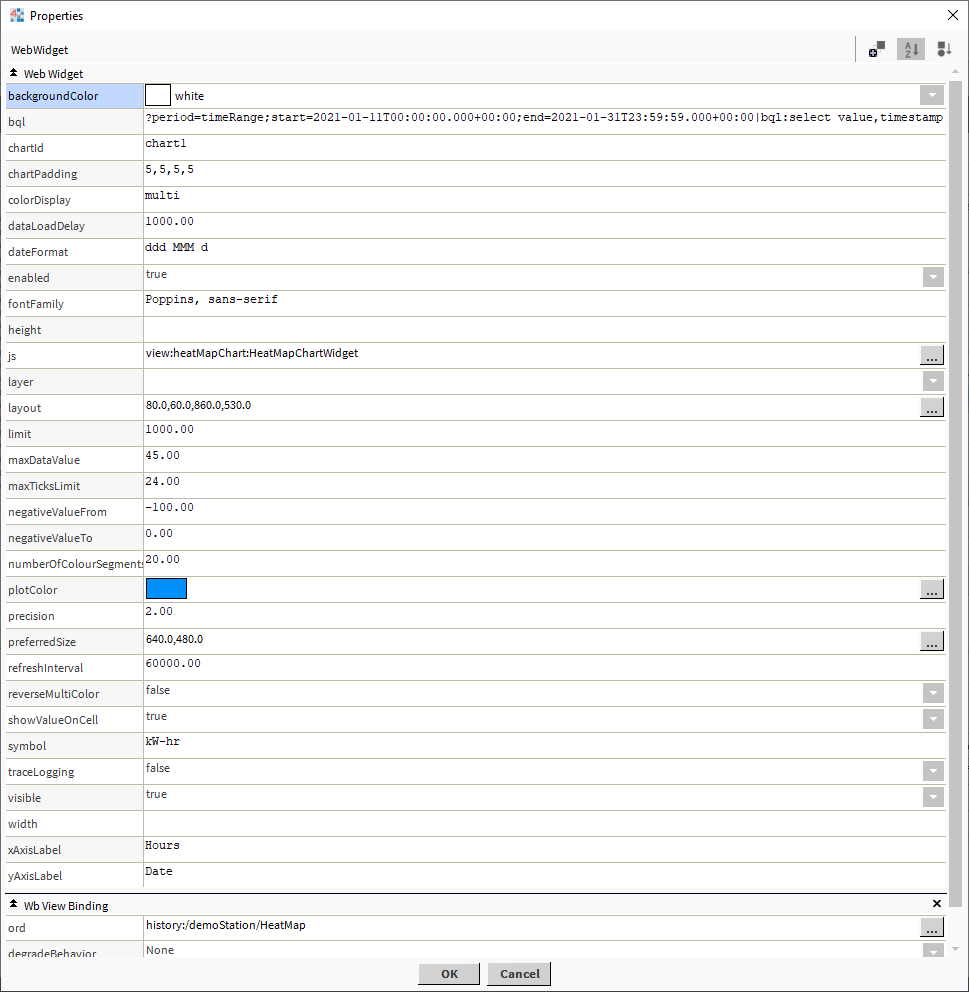
Changing Widget Properties - most properties are self-explanatory but some require some explaining.
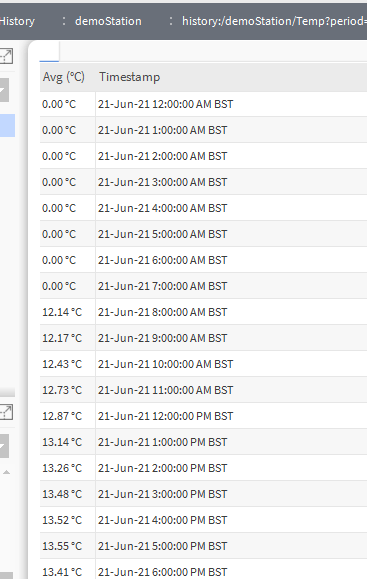
Ord:
Set to a history ord e.g. history:/demoStation/HeatMap

BQL:
Examples:
?period=today|bql:select value,timestamp
?period=timeRange;start=2021-01-11T00:00:00.000+00:00;end=2021-01-31T23:59:59.000+00:00|bql:select value,timestamp
?period=timeRange;start=2021-01-11T00:00:00.000+00:00;end=2021-01-31T23:59:59.000+00:00|bql:history:HistoryRollup.rollup(history:RollupInterval 'hourly')|bql:select avg,timestamp

Date Format:
Examples:
dddd h:mmtt d MMM yyyy = Friday 9:49am 19 Jan 2018
M/d/y = 1/19/2018
HH:mm:ss = 09:49:29
hh:mm:ss TT = 09:49:39 AM
yy/M/d = 18/1/19
ddd MMM d \a\t h:mm TT = Fri Jan 19 at 9:49 AM

Max Data Value:
The max data value. Choose a number just higher that the hightest data value.

Number of Color Segments:
The widget will automatically create the color shades depending on the number of segements.

Reverse Multi Color:
Set it to multi-colour which goes from green to red or flip it to red to green.

Color Display:

Set to multi or single

Multi:

Image

Single:

Image

Data Example:

history:/demoStation/HeatMap?period=timeRange;start=2021-01-11T00:00:00.000+00:00;end=2021-01-31T23:59:59.000+00:00|bql:select value,timestamp

Image

Custom Ranges:

You can also add you own ranges and colours. This is in json format. Verify your json using https://jsoneditoronline.org/ The json string must be compacted, as in removing all line breaks and white space. On the link above there is an option to do this.

    
[
  {
    "from": 40,
    "to": 45,
    "color": "#57bb8a",
    "name": 0
  },
  {
    "from": 45,
    "to": 50,
    "color": "#9ad652",
    "name": 1
  },
  {
    "from": 50,
    "to": 55,
    "color": "#ddf11b",
    "name": 2
  },
  {
    "from": 55,
    "to": 60,
    "color": "#f8e315",
    "name": 3
  },
  {
    "from": 60,
    "to": 65,
    "color": "#eaad42",
    "name": 4
  },
  {
    "from": 65,
    "to": 75,
    "color": "#dd776e",
    "name": 5
  },
  {
    "from": -100,
    "to": 0,
    "color": "#ffffff"
  }
]


Using in your HTML Page


You can now use the widget in your custom html page as long as the html file is in a appropriate station directory. E.g.:
C:/../station/shared/demo1.html

1. Create an html page and place in your station files directory.
2. Create a div element and give it an id so you can inject the widget into this area. E.g.: widget1.
3. Add the following scripts before the closing head tag or the closing body tag. E.g.:

    
        script type="text/javascript">

        var require = {
        paths: {
        "nmodule": "/module",
        "baja": "/module/bajaScript/rc/plugin/baja",
        "bajaScript": "/module/bajaScript/rc",
        "bajaux": "/module/bajaux/rc",
        "lex": "/module/js/rc/lex/lexplugin",
        "css": "/module/js/com/tridium/js/ext/require/css",

        "jquery": "/module/js/rc/jquery/jquery-2.1.1",  // For N4.4 or higher use /module/js/rc/jquery/jquery-3.2.0.min
        "Promise": "/module/js/rc/bluebird/bluebird",

        // these are runtime dependencies
        "hbs": "/module/js/rc/require-handlebars-plugin/hbs", // For N4.4 or higher use /module/js/rc/handlebars/handlebars.min-v4.0.6
        "i18nprecompile": "/module/js/rc/require-handlebars-plugin/hbs/i18nprecompile",
        "json2": "/module/js/rc/require-handlebars-plugin/hbs/json2",
        "underscore": "/module/js/rc/underscore/underscore",
        },

        hbs: {
        disableI18n: true
        }
        }
        </script>
        <script type="text/javascript"
                src="/module/js/com/tridium/js/ext/require/require.min.js"></script>
        <script>
        require(['/module/heatMapChart/rc/heatMapChart.run.js'], function (app) {

            app.initialiseChart({
                backgroundColor: '#263238',
                bql: "?period=monthtodate|bql:history:HistoryRollup.rollup(history:RollupInterval 'hourly')|bql:select avg,timestamp", // ?period=today|bql:select value,timestamp
                chartPadding: '5,5,5,5', //  top, right, bottom, left
                chartId: 'chart1',
                colorDisplay: 'multi', // single or multi
                customRanges: '[{"from":40,"to":45,"color":"#57bb8a","name":0},{"from":45,"to":50,"color":"#9ad652","name":1},{"from":50,"to":55,"color":"#ddf11b","name":2},{"from":55,"to":60,"color":"#f8e315","name":3},{"from":60,"to":65,"color":"#eaad42","name":4},{"from":65,"to":75,"color":"#dd776e","name":5},{"from":-100,"to":0,"color":"#ffffff"}]',
                plotColor: '#7460ee', // when single color used
                dataLoadDelay: 250, // in milliseconds
                dateFormat: 'ddd MMM d', // see help for more examples
                divId: '#widget1',
                height: null,
                fontFamily: 'Poppins, sans-serif', // Web fonts, e.g. arial, sans-serif
                labelColor: '#888888',
                limit: 1000,
                maxTicksLimit: 24, // maximum number of ticks and gridlines to show for x-axis
                maxDataValue: 75,
                negativeValueFrom: -100,
                negativeValueTo: 0,
                numberOfColourSegments: 5,
                ord1: 'history:/demoStation/Series4', // use absolute ord for html. main ord
                precision: 2,
                refreshInterval: 60000, // in milliseconds
                reverseMultiColor: false,
                showValueOnCell: true,
                symbol: 'kW-hr',
                traceLogging: false,
                width: null,
                xAxisLabel: 'Hours',
                yAxisLabel: 'Date'
            });
        });
        </script>
        </head>
        <!--html to go here-->
        <div id="widget1" style="width:300px;height:300px;"></div>
        <!--Rest of your html below...-->
                                    

You May Also Like


Energy View

tridium bms graphics

N4 View Builder™©

tridium bms system

Comparison Charts

tridium charting

back to more widgets...